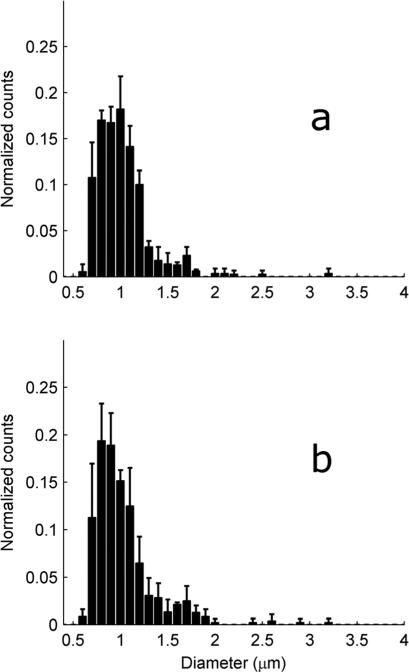
Fig. 7.
Distribution of the gastrocnemius mitochondrial diameter from mice with different exercise histories. To create each figure, the histograms generated from each tissue sample were normalized by the total number of counts, and then all normalized histograms within a mouse group were averaged. The solid bars represent the mean while the error bars represent one standard deviation. (a) EXR, 2 mice. (b) SED, 3 mice.

