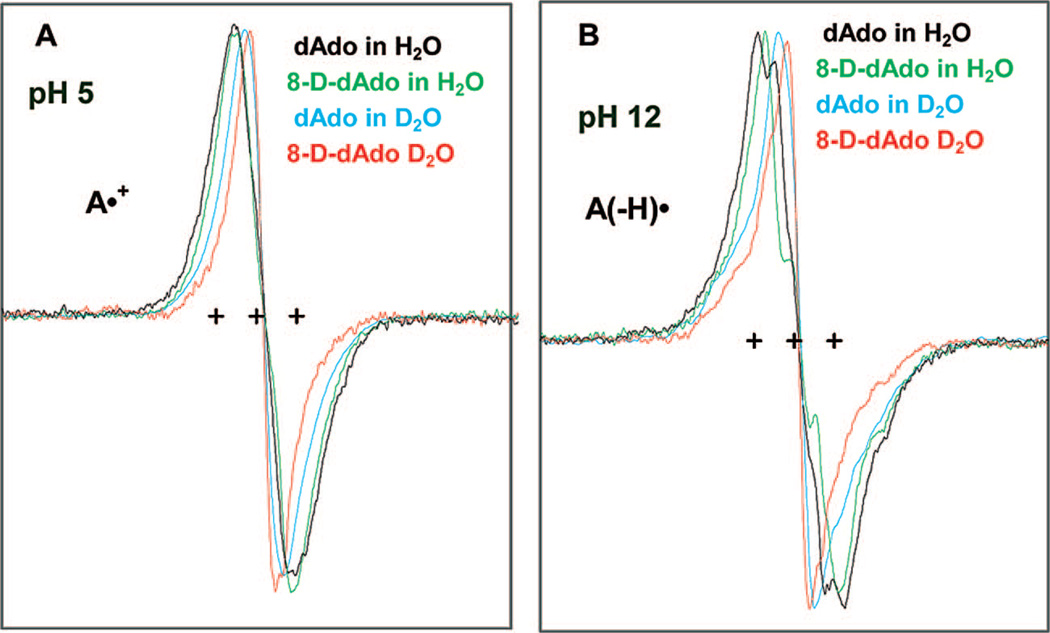
Figure 2.
ESR spectra of one-electron oxidized adenine in dAdo or in 8-D-dAdo (3 mg/mL) produced by Cl2•− oxidation at 148 K (recorded at 77 K) in 7.5 M LiCl glass in H2O or in D2O in the presence of K2S2O8 at (A) native pH or pD (ca. 5) and at (B) pH or pD ca. 12. The three reference markers in this figure and in all the other figures of this report showing ESR spectra are Fremy’s salt resonances with the central marker is at g = 2.0056, and each of the three markers is separated from one another by 13.09 G.

