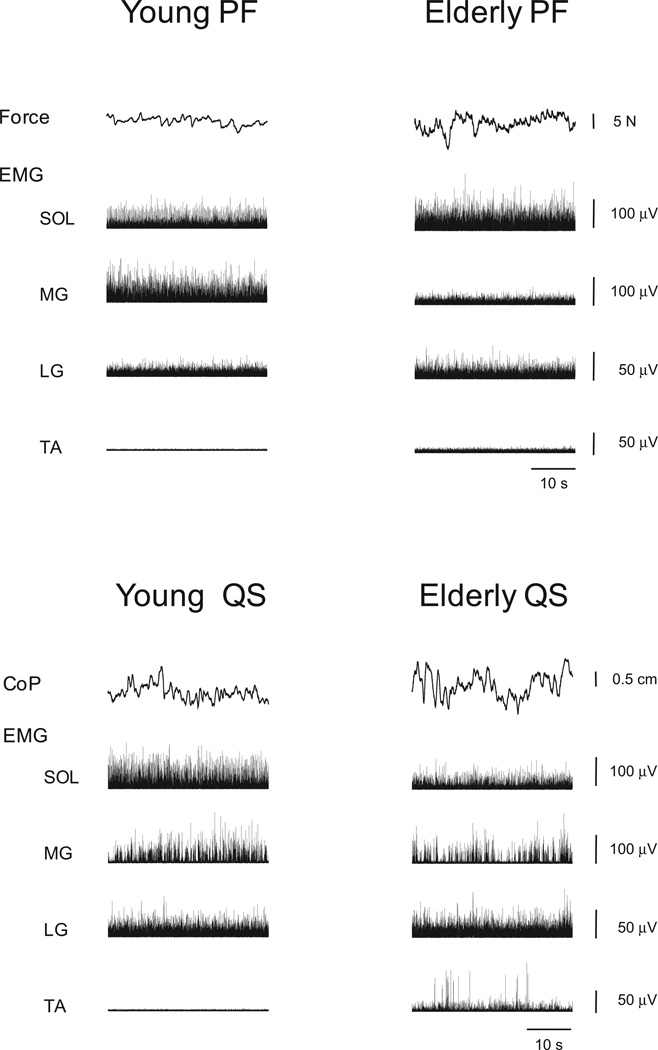
Figure 1.
Representative recordings of fluctuations in plantar flexion force or foot center of pressure (CoP), rectified electromyogram (EMG) in soleus (SOL), medial gastrocnemius (MG), lateral gastrocnemius (LG) and tibialis anterior (TA) during steady isometric plantar flexion (PF) at 5% of maximal voluntary contraction (top panels) and during quiet standing (QS) (bottom panels) in young (left column) and elderly (right column) adults.

