Figure 1.

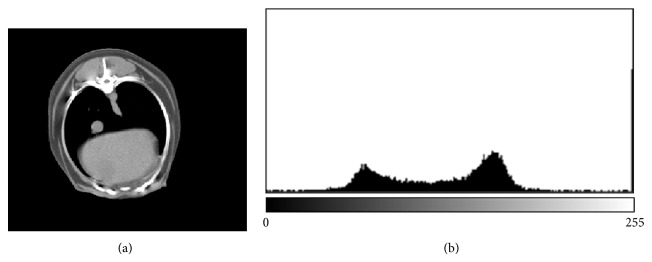
Representative CT image with a histogram to show the ranges in greyscale units 20–130 (fat), 131–220 (lean), and 221–255 (bone).

Representative CT image with a histogram to show the ranges in greyscale units 20–130 (fat), 131–220 (lean), and 221–255 (bone).