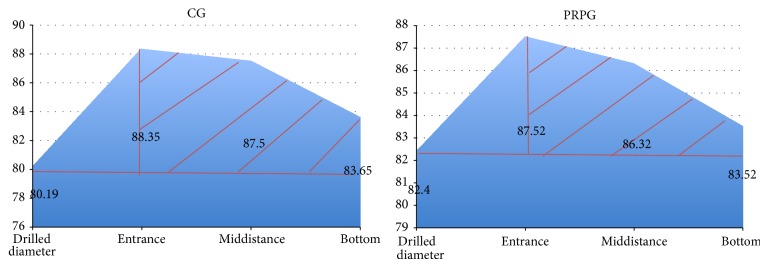
Figure 5.

CG mean tunnel dilation at the entrance, middistance, and bottom end of the tunnel at 12 months. Horizontal red line shows the mean drilled diameter and shadowed area demonstrates the shape of tunnel dilation (conical). PRPG mean tunnel dilation at the entrance, middistance, and bottom end of the tunnel at 12 months. Horizontal red line shows the mean drilled diameter and shadowed area demonstrates the shape of tunnel dilation (conical).
