Figure 3.

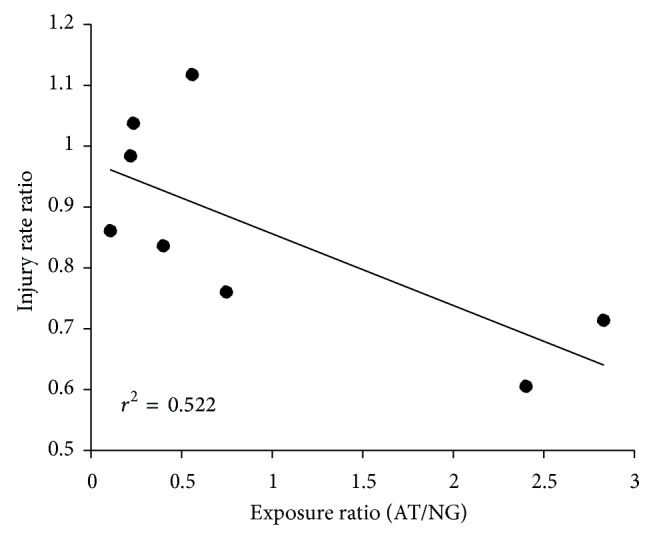
The correlation between the exposure ratio (exposure on AT/NG) and the injury incidence rate ratio. Each data point represents a single study.

The correlation between the exposure ratio (exposure on AT/NG) and the injury incidence rate ratio. Each data point represents a single study.