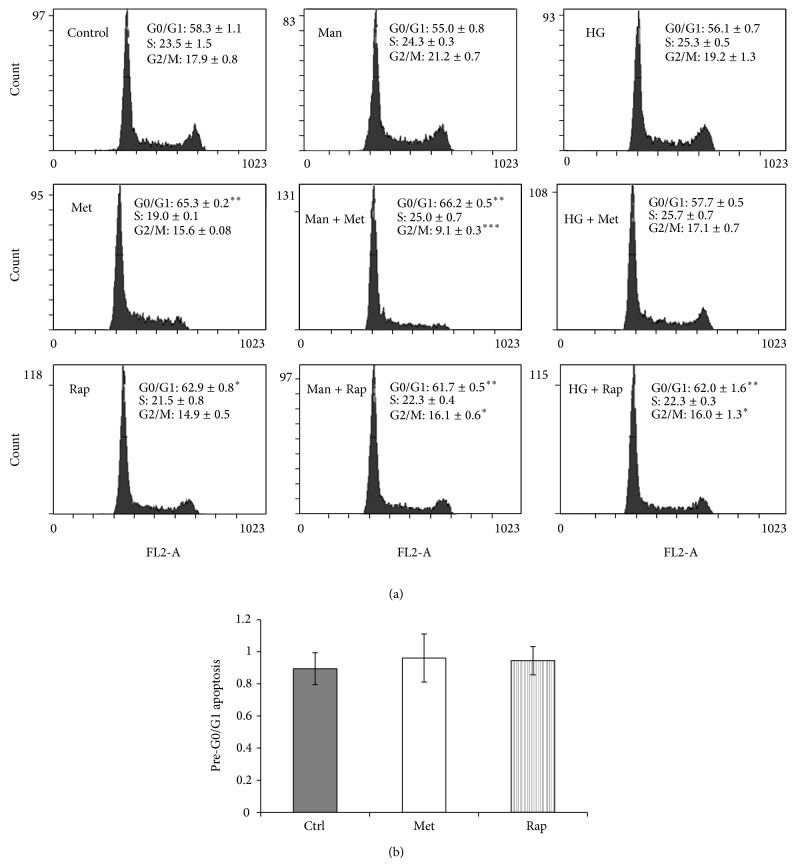
Figure 2.
(a) High glucose inhibits metformin-induced cell cycle arrest in G0/G1 phase. HEK293 cells were cultured in 5.5 mM (Control), 5.5 mM D-glucose + 24.5 mM mannitol (Man), and 30 mM D-glucose (HG) for 3 days. For the last 24 hours, metformin 8 mM (Met) or rapamycin 100 nM (Rap) was added. Representative flow cytometry panels containing data expressed as mean per cent cell cycle distribution + SEM. * P < 0.05; ** P < 0.01; *** P < 0.001, relative to control. (b) Percentage of cells in pre-G0/G1 apoptosis. Data expressed as mean ± SEM.

