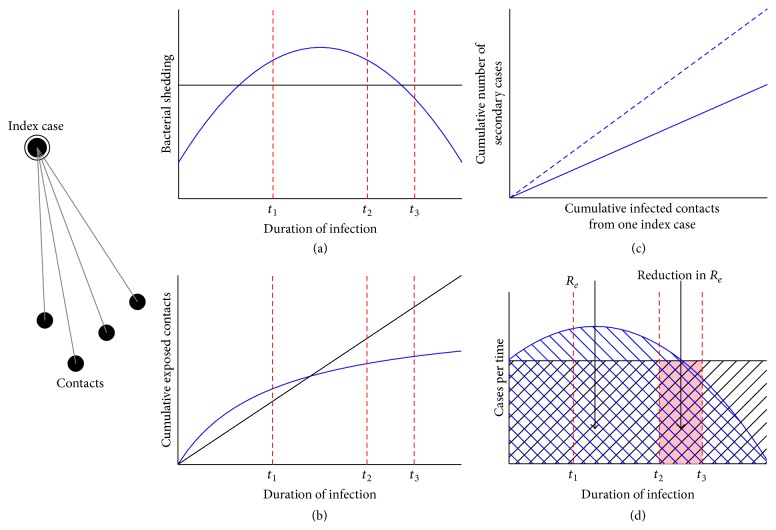
Figure 2.
(a) The rate of bacterial shedding over the duration of infection may be a constant function (black line) or change over time (blue line). (b) The cumulative number of contacts exposed to TB over the duration of infection may increase linearly over time (black line) or may plateau as contact pool becomes saturated or patient is too ill to circulate in the community. The potential impact of a novel intervention may depend on this assumption; given a linear increase, earlier intervention (t 1) would be likely preferred. While given the second curve with only a small increase and plateau, the impact between intervening at t 1 and t 2 might not be as great; therefore other factors including cost-effectiveness may come into play. (c) The cumulative number of secondary cases resulting from one index case in relation to the number of cumulative infected contacts: there are factors associated with bacterial virulence and host susceptibility that impact the rate of progression from infection to disease. This rate may be steeper among immunosuppressed contacts, for example, (dotted line) compared with immunocompetent contact (solid line). (d) The effective reproductive number (R e) is the number of secondary cases generated over a given time period. Bacterial shedding, contact mixing pattern, and bacterial and host susceptibility all contribute to the overall rate of secondary cases generated over time; depending on what assumptions are made these rates could be thought to stay constant over time or vary, perhaps tapering off over the duration of infection. By reducing the time to diagnosis and treatment initiation we hope to reduce the number of secondary cases but the amount of impact depends on assumptions around the shape of the curve over time. The hashed area represents the secondary cases generated from one index case while the shaded area represents the potential reduction in secondary cases given an intervention at t 2. Figure adapted with permission from Dowdy et al. [7].

