

Abstract
In contrast to rodent cells, normal human fibroblasts are generally resistant to neoplastic transformation in vitro. Here, we report the derivation and characterization of a spontaneously transformed cell line from normal human IMR90 fibroblasts transduced with E1A and Ras oncogenes. Unlike the parental, non-tumorigenic E1A/Ras-expressing IMR90 cells, these spontaneously transformed cells displayed aberrant growth potential in vitro and were capable of tumorigenesis in vivo. In contrast to the parental E1A/Ras-expressing cells, both the spontaneously transformed cells and cells derived from resultant tumors displayed specific t(7q;8q) and t(5q;17) structural chromosomal changes. Chromosome 8q contains c-Myc, which is capable of activating the telomerase catalytic subunit hTERT. Notably, upregulation of c-Myc, hTERT and telomerase activity were detected only in the tumorigenic cells. Transduction of Myc siRNA into the tumorigenic cells led to a concomitant downregulation of hTERT. Furthermore, transduction of Myc or hTERT into the non-tumorigenic E1A/Ras-expressing IMR90 cells was able to confer tumorigenesis on these cells. These studies suggest that the t(7;8) translocation may result in Myc overexpression and its subsequent activation of hTERT, which may contribute to the tumorigenicity of the IMR90 cells. Furthermore, this report describes additional successful neoplastic transformation of human IMR90 fibroblasts by defined genetic elements. The spontaneously transformed cells we have derived provide a valuable model system for the study of neoplastic transformation.
Introduction
Normal human cells possess safeguards that prevent neoplastic transformation (1). Consequently, tumorigenesis is a multistep process in which a series of genetic and epigenetic events leads to the emergence of cells that have escaped normal growth control mechanisms (2). One important safeguard against neoplastic transformation is replicative senescence (3). This process is initiated when chromosome ends, or telomeres, gradually shorten with each population doubling, eventually reaching a critically short length, and triggering a DNA damage-like response that leads to permanent cell cycle arrest. In many instances, induction of telomerase activity is involved in transformation processes. Indeed, studies have shown that aberrant expression of telomerase in several primary human cell strains prevents telomere shortening and senescence, leading to cell strains with extended lifespans (4–9).
Although human cells that have bypassed senescence exhibit an extended lifespan in culture, they remain non-tumorigenic in vivo (9). Moreover, these cells may eventually cease proliferation, due to the activation of a second proliferative barrier called ‘crisis’. Consequently, multiple genetic alterations are required to override the safeguard mechanism in human cells in order to initiate immortalization and neoplastic transformation. Consistent with this notion, overexpression of the catalytic subunit of human telomerase, hTERT, can cooperate with SV40 T antigens and oncogenic Ras to cause neoplastic transformation of normal human cells (10,11). On the other hand, telomerase-independent mechanisms also exist. For instance, combined expression of three oncogenes, adenovirus E1A, H-RasV12 and Mdm2, is sufficient to convert a normal human cell into a cancer cell in the absence of telomerase (12).
Unlike primary rodent cells, transduction of E1A and H-RasV12 cannot transform normal human diploid fibroblasts into a tumorigenic state (12,13). Despite the inability of E1A and H-RasV12 to transform normal human diploid IMR90 fibroblasts, we have now obtained a spontaneously transformed variant from these cells after transduction with the two oncogenes. To gain insight into the mechanism involved in the spontaneous transformation of these cells, we have identified a small number of highly specific genetic alterations that are associated with the acquisition of tumorigenicity. Furthermore, we have established additional successful neoplastic transformation of normal human diploid fibroblasts using defined genetic elements. These cells may provide a novel model system for studying neoplastic transformation of human fibroblasts.
Materials and methods
Cell culture and retroviral gene transfer
Human diploid lung IMR90 fibroblasts (passage 12; ATCC, Manassas, VA) were cultured in DMEM (Mediatech, Herndon, VA) supplemented with 10% fetal bovine serum (FBS) (Hyclone, Logan, UT) and antibiotics as described previously (14). Cells (passage 15–20) were transduced with E1A (E1A.12S.Lpc) and oncogenic H-Ras (c-H-RasV12.pWzl) via retroviral gene transfer as described previously (15). Human diploid forskin BJ fibroblasts (ATCC) and IMR90 fibroblasts transduced with E1A, RasV12 and Mdm2 were prepared as described previously (12). To generate cells expressing E1A/Ras/Myc or E1A/Ras/hTERT, retroviruses expressing E1A and oncogenic Ras were produced by using a retroviral construct containing both E1A and H-RasV12 (E1A/Ras.pBabe), and were used to transfect IMR90 fibroblasts. Following the retroviral transduction, cells were sequentially transduced with retroviruses expressing c-Myc (c-Myc.pLpc) or hTERT (hTERT.MaRXII). Cells stably expressing the transgenes were selected by puromycin or hygromycin as described previously (15). For the serum starvation experiments, cells were plated at ~105 cells onto a 10 cm dish. The medium was removed 12 h after plating and cells were washed three times with phosphate-buffered saline (PBS). Cells were subsequently cultured in serum-free medium for the indicated time. Cell viability was measured by the trypan blue exclusion method using 0.4% trypan blue (Sigma, St Louis, MO). At least 200 cells from each sample group were counted. For the drug treatment experiment, cells were plated as described above and were treated with etoposide (Sigma) at various concentrations or with 0.1% dimethyl sulfoxide (DMSO; Sigma) for 24 h. Cell viability was measured as described above. DNA fragmentation was measured by staining the cells with 4′,6-diamidino-2-phenylindole (DAPI, 1 μg/ml; Sigma).
Anchorage-independent growth
Anchorage-independent growth was analyzed as described previously (12). Briefly, ~105 cells were plated in 0.3% low melting point agarose/growth medium onto a 60 mm dish with a 0.5% agarose underlay. Fresh top agar was added weekly.
Western blot analysis
Cells were collected by trypsinization and lysed in Laemmli sample buffer. Protein concentration was determined by using the Protein Assay II Kit (Bio-Rad, Hercules, CA). A total protein lysate of ~20 μg, from each cell type, was resolved by SDS–PAGE and transferred to an immobilon-P membrane (Millipore, Billerica, MA). Western blot analysis was carried out as described previously (14) using the following antibodies: E1A (M58; Cold Spring Harbor Laboratory, NY), c-Myc (9E10.3, Neomarkers, Fremont, CA), α-Tubulin (Sigma).
RNA interference
RNA interference was carried out using Silencer™c-myc siRNA or a Silencer™ Negative control siRNA (Ambion, Austin, TX). Two-hundred nM of each siRNA was transfected into IMR90-M cells using Lipofectamine 2000 (Invitrogen, Carlsbad, CA). Cells were collected for western blot analysis or RT–PCR analysis 24 h after transfection.
RT–PCR analysis
RNA was isolated from frozen cell pellets using the RNeasy RNA isolation kit (Qiagen, Valencia, CA). A total RNA of 1 μg was annealed to 500 ng of oligonucleotide dT(18) at 65°C for 15 min. RNA was reverse transcribed with M-MLV-reverse transcriptase as described by the manufacturer (Invitrogen, Carlsbad, CA). PCR reactions were performed in a 15 μl volume using HotMaster Taq DNA Polymerase as described by the manufacturer (Eppen-dorf, Westbury, NY). Reaction parameters included an initial denaturation at 94°C for 2 min, followed by 22 (β2-microglobulin), 35 (hTERT) or 30 (c-Myc) cycles at 94°C for 30 s, 55°C (β2-microglobulin) or 58°C (hTERT and c-Myc) for 30 s, and 69°C for 30 s. Primer sequences were as follows: 5′-TTAGCTGTGCTCGCGCTACTCTCTC-3′ and 5′-GTCGGATTGATGAAACCCAGACACA-3′ for β2-microglobulin, 5′-ATCAGAGCCAGTCTCACCTTC-3′ and 5′-GCAGGAGGATCTTGTAGATGT-3′ for hTERT, and 5-CTGGTGCTCCATGAGGAG-3′ and 5′-AGGTGATCCAGACTCTGAC-3′ for c-Myc.
Telomerase activity assay
Telomerase assays were performed on frozen cell pellets using the TRAPeze telomerase detection kit (Intergen, Purchase, NY). TRAP products were detected by ethidium bromide staining. As a negative control, the reaction was heat-inactivated at 85°C for 10 min.
Telomere length assay
Genomic DNA was isolated from frozen cell pellets using Genomic-tip 100/G following the manufacturer’s instruction (Qiagen). Genomic DNA of 2 μg was digested with HinfI and RsaI, resolved on 0.8% agarose gel and transferred to a nylon membrane (Millipore). Telomere length was detected using the Telo TAGGG Telomere Length Assay following the manufacturer’s instructions (Roche, Indianapolis, IN).
In vivo tumor assay
The in vivo tumor assay was performed using female scid (severe combined immunodeficient) mice (Teconic, Germantown, NY). Retrovirally transduced human diploid IMR90 fibroblast populations were grown to confluence, trypsinized and resuspended as single cell suspension in sterile-filtered PBS shortly before subcutaneous injection into the rear flank region of female scid mice. For each group, 10 mice received 200 μl subcutaneous injections of 1.1 × 10⁷ IMR90 cells. Starting at Day 12 after implantation, the two perpendicular diameters A and B (where A ≥ B) of each palpable tumor were measured every 4–6 days using a metric caliper (FACOM Tools, Chicago, IL). The tumor volume (expressed in mm3) was calculated using the following formula: V = A × B2/2 (where A is the length and B is the width of the tumor). When the longer diameter reached 10 mm, mice were killed and tumors excised and weighed. Experiments were terminated and non-tumor-bearing mice killed at Day 76 after cell inoculation. All mice were examined for signs of metastasis to the abdominal cavity and pneumothorax. The IMR90 tumors were cut into two equal pieces, one of which was immediately immersed into formalin fixative, paraffin-embedded and processed for histopathological and immunohistochemical analyses (see below). The other half of the tumor tissue was minced into tiny pieces and tumor cells dispersed using enzymatic (trypsin) and mechanical (up and down pipetting) means. The tumor cell suspension was then seeded into 100 mm Petri dishes and cells grown to confluence for long-term storage in liquid nitrogen and molecular studies.
Spectral karyotyping
Spectral karyotyping (SKY) was performed to determine the karyotypes of cells. Cells at growth phase, which received colcemid for 2 h at 0.06 μg/ml, were treated with the standard hypotonic solution, fixed, followed by meta-phase spread. The chromosome preparations were digested with RNase/pepsin, denatured and then hybridized for 36–40 h at 37°C with human SKY probes (Applied Spectral Imaging, Vista, CA) using Hybrite (Vysis, Downers Grove, IL), and then analyzed as described previously (16,17). At least 25 metaphase figures from each sample group were scored. All the SKY analyses were preformed at the RPCI SKY facility.
CGH-BAC array analysis
A genome-wide resource of ~6000 FISH mapped, gene/marker content verified, sequenced bacterial artificial chromosomes (BAC) clones from the RPCI-11 human BAC library are represented as immobilized DNA targets on glass slides for comparative genomic hybridization analysis using arrays (aCGH) as described previously (18,19). Each clone is spotted in triplicate at 250 μm intervals (see http://genomics.roswellpark.org for a complete list of clones). Hybridization and washing of the arrays as well as image analysis were performed as described previously (18,19).
Results
Normal human diploid IMR90 fibroblasts exhibit resistance to transformation by combined expression of E1A, H-RasV12 and Mdm2, as compared with BJ fibroblasts
While combined expression of E1A and H-RasV12 has been shown to transform primary mouse cells, the same gene combination fails to convert normal human fibroblasts into cells capable of in vivo tumorigenesis, although human foreskin BJ fibroblasts co-expressing E1A and H-RasV12 were capable of causing robust anchorage-independent growth in semisolid media (Figure 1A and B). Interestingly, the same gene combination in normal human diploid lung IMR90 fibroblasts was incapable of causing anchorage-independent growth in the same assay (Figure 1A and B). Neoplastic transformation of normal human BJ fibroblasts can be achieved by the combined expression of E1A, Ras and Mdm2 (12). Surprisingly, in contrast to normal human BJ fibroblasts transduced with E1A, H-RasV12 and Mdm2, which were able to form large colonies in soft agar, normal human IMR90 fibroblasts transduced with the same gene combination exhibited poor capacity to initiate colony formation in soft agar, an assay that is predictive of tumorigenic capability (Figure 1A and B). These observations suggest that normal human IMR90 fibroblasts, in contrast to BJ and other normal human fibroblast lines (12), possess a tightly regulated safeguard mechanism to resist oncogenic transformation.
Fig. 1.

Compared with BJ fibroblasts, normal human diploid IMR90 fibroblasts exhibited resistance to transformation by combined expression of E1A, Ras and Mdm2. (A) IMR90 and BJ fibroblasts were transduced with E1A and H-RasV12, and then plated into semisolid media (a, b, c, d). Notably, BJ fibroblasts co-expressing E1A and H-RasV12 (c) were capable of robust colony formation in this assay, whereas IMR90 fibroblasts co-expressing E1A and H-RasV12 were not (a). Normal IMR90 cells (b) and 293T cells (d) were used as negative and positive controls, respectively. IMR90 or BJ fibroblasts were transduced with retroviruses to direct the expression of three genes, E1A, Mdm2 and H-RasV12, and plated into semisolid media in order to assess the rate of anchorage-independent growth (e, f). As previously observed (12), BJ/E1A+Mdm2+RasV12 cells resulted in robust colony formation (f), whereas IMR90/E1A+Mdm2+RasV12 expressing cells were incapable of promoting significant anchorage-independent growth (e). (B) Colonies containing >100 cells were counted from triplicate platings of cells with the indicated genotype in order to determine the rate of colony formation.
The standard error from the mean is indicated.
Spontaneous transformation of E1A/Ras-expressing human IMR90 fibroblasts in culture
Despite the inability to transform normal human IMR90 fibro-blasts by E1A and H-RasV12 (Ras), we recently derived a spontaneously transformed cell line from IMR90 cells transduced with E1A and Ras, ~2 months after the initial gene transfer. In addition to their distinct cell morphology, we observed altered growth potential in the spontaneously transformed cells. In contrast to the parental E1A/Ras-expressing cells (IMR90-P), which were prone to apoptosis when plated at low cell density, the spontaneously transformed cells (IMR90-M) were able to form colonies when plated at low cell density, and achieved much higher saturation densities in culture (data not shown). The IMR90-M cells displayed tight cell–cell junctions, shrunken cytoplasm and prominent nucleoli, which were readily distinguishable from the IMR90-P cells (Figure 2A). These observations suggest that the spontaneously transformed cells have acquired additional genetic changes, resulting in this distinct phenotype. To investigate effects on growth rate, we cultured both the IMR90-P cells and the IMR90-M cells for 3 days in medium containing various concentrations of FBS and monitored their proliferation/survival rates using the trypan blue exclusion assay. Strikingly, under serum-free or low-serum (0.1%) conditions, the majority of the IMR90-P cells died within 3 days, while IMR90-M cells remained viable for up to 2 weeks (Figure 2B and data not shown). Moreover, the IMR90-M cells appeared to accumulate in culture at a faster rate in 10% serum than the parental cells (Figure 2B, ‘10% FBS’), suggesting that they had gained an additional growth advantage.
Fig. 2.

The spontaneously transformed E1A/Ras-expressing IMR90 fibroblasts exhibited altered cell morphology and growth potential. (A) Cell morphology of the parental E1A/Ras-expressing IMR90 fibroblasts (IMR90-P) and the spontaneously transformed E1A/Ras-expressing IMR90 fibroblasts (IMR90-M). (B) Cell viability assay. IMR90-P cells (P) or IMR90-M (M) cells were cultured in the growth medium containing the indicated percentage of serum. Cell numbers were counted ~6 h after plating (Day 0) or 3 days after plating (Day 3).
The increased growth potential of the IMR90-M cells raised the possibility that they might have undergone spontaneous neoplastic transformation. To test this hypothesis, we performed an in vivo tumor assay using immunodeficient scid mice. Eight injections of each cell type were initially performed. After injection, the scid mice were monitored for tumor growth over time using a caliper. Six out of eight mice injected with the IMR90-M cells began to show palpable tumors within 2 weeks and the tumors continued to grow progressively over time (data not shown). In contrast, no tumors developed in the mice injected with the IMR90-P cells over the same time period (Table I). We noticed, however, a large variation in terms of tumor growth in vivo between animals. In order to confirm tumorigenicity of the IMR90-M cells, an additional in vivo tumorigenesis assay was performed. In the second experiment, 20 injections with IMR90-M cells and 10 injections with the parental E1A/Ras-expressing cells were performed. A total of 19 out of 20 mice injected with the IMR90-M cells developed tumors within 2 weeks (Table I). As in the initial assay, none of the mice injected with the IMR90-P cells developed tumors (Table I). The animals were killed 6 weeks after the injections, and the subcutaneous tumors were removed from the animals and weighed. The results showed that the developed tumors varied in size (data not shown). Three of the tumors were minced and trypsinized for in vitro subculturing. These explanted cells displayed phenotypes indistinguishable from those of the transformed E1A/Ras-expressing cells maintained in vitro (data not shown), indicating that they originated from the injected IMR90-M cells. Indeed, both IMR90-M cells and the tumor-derived cells maintain comparable expression levels of the transgenes, E1A and Ras, as the IMR90-P cells (data not shown). Taken together, these studies demonstrate that the IMR90-M cells were tumorigenic.
Table I.
Number of tumors developed in scid mice injected with the indicated cell type
| Cell types | Number of tumors developed
|
||
|---|---|---|---|
| Experiment 1* | Experiment 2* | Experiment 3* | |
| Parental E1A/Ras-expressing cells (IMR90-P) | 0/8 | 0/10 | 0/10 |
| Mutant E1A/Ras-expressing cells (IMR90-M) | 6/8 | 19/20 | 10/10 |
| E1A/Ras/Myc-expressing cells | NA | NA | 7/10 |
| E1A/Ras/hTERT-expressing cells | NA | NA | 5/10 |
Three independent experiments were performed.
NA, not applicable.
Normal fibroblasts are refractory to apoptosis, for example in response to DNA damage-inducing agents (20). In contrast, cells transduced with E1A and Ras were more prone to apoptosis, largely due to activation of the p53-dependent pathway by E1A (20). Because disruption of apoptotic pathways can contribute to tumor development (21), we tested the IMR90-M cells for their ability to undergo apoptosis in response to the DNA damaging agent etoposide. Both the IMR90-P cells and the IMR90-M cells were treated with varying concentrations of etoposide. Normal IMR90 fibroblasts were used as a negative control. Cell viability was assessed using the trypan blue exclusion assay 24 h after treatment. The results indicated that the sensitivity of IMR90-M cells to etoposide was almost identical to that of the IMR90-P cells (Figure 3). This experiment suggested that the mechanism underlying the neoplastic transformation of the IMR90-M cells may not be directly related to inactivation of the apoptotic machinery, but rather to the acquisition of an improved growth advantage.
Fig. 3.
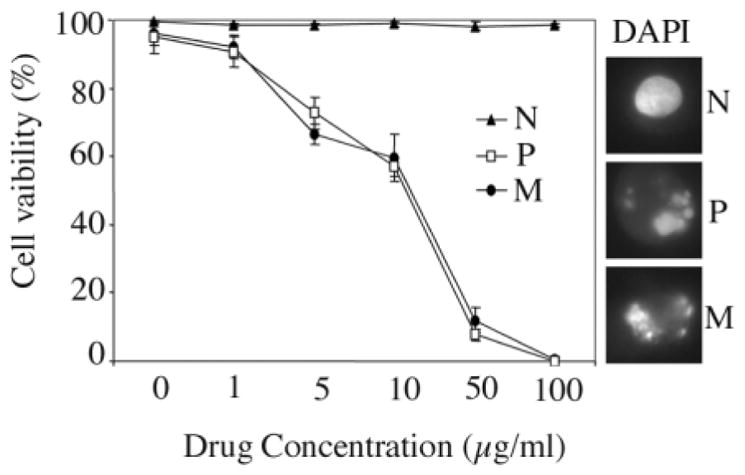
The spontaneously transformed E1A/Ras-expressing IMR90 fibroblasts remained sensitive to apoptosis induced by etoposide. Normal IMR90 fibroblasts (N), IMR90-P fibroblasts (P) or the IMR90-M fibroblasts (M), were treated with etoposide at various concentrations. Twenty-four hours after the treatment, cells were subjected to a trypan blue exclusion assay to determine cell viability. DAPI was used to stain nuclei for the assessment of chromatin condensation as a feature of apoptosis.
Spontaneously transformed cells exhibit two specific chromosome translocations that result in both gain and loss of chromosomal DNA
Tumorigenesis is often associated with the accumulation of specific genetic changes, some of which manifest as structural chromosome changes. To investigate whether cytogenetic alterations were associated with tumorigenicity in the IMR90-M cells, we performed SKY (16,17). At least 25 meta-phase spreads from each of the IMR90-P cells, IMR90-M cells and the tumor-derived IMR90-M cells (IMR90-T) were analyzed. The karyotype of IMR90-P cells was apparently normal 46XX in all 25 analyses (Figure 4A). In contrast, the IMR90-M cells displayed specific chromosomal translocation. More specifically, all metaphase spreads showed a characteristic t(7;8) translocation whereas 57% of them harbored an additional t(5;17) translocation (Figure 4B). The same two chromosomal translocations were also present as the only cytogenetic changes in the IMR90-T cells (Figure 4C). Again, all meta-phase spreads from IMR90-T cells showed t(7;8) translocation whereas 66% (tumor no.1) or 88% (tumor no.2) of them showed an additional t(5;17) translocation. There is thus strong correlative evidence that acquisition of a tumorigenic potential by IMR90-M cells is accompanied by the cytogenetic changes described above.
Fig. 4.

SKY analysis. (A). The IMR90-P cells exhibited normal 46XX karyotype. (B) The IMR90-M cells exhibited two chromosomal t(7;8) and t(5;17) translocations. (C) The IMR90-T cells exhibited two chromosomal t(7;8) and t(5;17) translocations.
aCGH-BAC provides a high-resolution approach for the analysis of numerical changes in genomic DNA (18). To determine the consequences of the chromosome translocations seen in the IMR90-M cells, we used the aCGH analysis as described previously (18,19,22) to further analyze the progression of genetic events resulting in the transformation of IMR90 cells. At an ~500 Mb resolution (Figure 5), aCGH analysis revealed that the IMR90-P cells did not exhibit deletion, duplication or amplification of any specific chromosomal domain (data not shown). In contrast, the IMR90-M cells showed gains and losses of chromosomal DNA associated with the translocations observed in these cells (Figure 5). As a result of the t(5;17) translocation, both gain and loss of chromosomal DNA were observed on the long arm of chromosome 5 (5q, ~120 Mb from the centromere) but there was no net loss of material from chromosome 17. This breakpoint resulted in the hemizygous loss of region 158.75–169.2 Mb from the tip of 5p and the gain of region 169.2–181.24 Mb in 5q35.1. The gene content of this region can be obtained from http://genome.ucsc.edu/cgi-bin/hgGateway?=human. On chromosome 7, the breakpoint in 7q22.1, located at position 100.32 Mb, resulted in hemizygous loss of chromosomal DNA distal to that point to 7qter. On chromosome 8, the 8q21.11 resulted in a single copy gain of chromosomal DNA from postition 74.72 Mb to 8qter. On the linear scale, the changes of ±0.5 were consistent with loss of a single copy (18) of the regions described above for chromosomes 7 and 8 and the deletion in 5q. The amplified distal 5q region showed a larger increase in copy number. At present, it is not clear whether the translocated part of chromosome 17 was derived from the interstitial domain of 17p, which showed some gain of BAC signal in the IMR90-M cells (Figure 5). Since the cytogenetic changes resulted in relatively few highly specific genetic alterations in the IMR90-M cells, it is likely that these genetic changes might have contributed the tumorigenic potential. Moreover, the very short latency period of tumor development in scid mice suggests that it is unlikely that significant additional genetic changes had occurred in vivo.
Fig. 5.

CGH-BAC array analysis. The IMR90-M cells exhibited both gain and loss of chromosomal DNA at Chr 5q, deletion at Chr 7q and amplification at Chr 8q. No significant numerical chromosomal change was detected at Chr17.
Spontaneously transformed cells exhibit aberrant expression of c-Myc and hTERT and an upregulation of telomerase activity
Elevated expression of proto-oncogenes can lead to aberrant expression of target genes and cellular transformation. The cellular proto-oncogene c-Myc is involved in cell cycle control and its overexpression caused by chromosomal translocation or gene amplification is frequently associated with tumorigenesis (23). Since the c-Myc proto-oncogene is included in the duplicated chromosome 8 in the IMR90-M cells (Figure 5), we analyzed the expression levels of c-Myc in these cells using RT–PCR and western blot analysis. The results indicated that the transcript and protein expression of c-Myc were indeed upregulated in both the IMR90-M cells and the IMR90-T cells, as compared with the IMR90-P cells (Figure 6A and B). While c-Myc overexpression could occur as a consequence of chromosomal amplification, we cannot rule out the potential contribution from other unidentified mechanisms.
Fig. 6.

Upregulation of hTERT and telomerase activity in the spontaneously transformed cells and the derived tumor cells. (A) RT–PCR analysis of c-Myc or hTERT expression in the indicated cell types. HeLa cells were used as a positive control for c-Myc and hTERT expression. β2 microglobulin (β2M) was used as a loading control for total RNA. The negative control is the reaction without reverse transcriptase (-RT). (B) Western blot analysis of c-Myc protein expression in the indicated cell types. Pheonix cells transduced with c-Myc was used as a positive control (ϕ-Myc) and Tubulin expression was used as a protein loading control. (C) Telomerase activity assay of the indicated cell types. Heat inactivation was used as a negative control. (D) Telomere length assay of the indicated cell types. DNA with low molecular weight (MW) and DNA with high MW were used as controls. N: normal IMR90 cells. P: IMR90-P cells. M: IMR90-M cells. T: IMR90-T cells.
The c-Myc protein activates transcription of numerous target genes (23), including the catalytic subunit of telomerase, hTERT (24,25). Due to the fact that c-Myc was upregulated in the IMR90-M cells, we examined the expression of hTERT in the IMR90-M and the IMR90-T cells using RT–PCR analysis. hTERT was undetectable in the IMR90-P cells, but upregulated in both the IMR90-M and the IMR90-T cells (Figure 6A). A PCR-based telomerase activity assay, the TRAP assay, was used to determine whether the aberrant expression of hTERT in the IMR90-M cells was associated with induction of telomerase activity. Consistent with the RT–PCR results, telomerase activity was not detected in either normal IMR90 cells or the IMR90-P cells, but was induced in both the IMR90-M cells and the IMR90-T cells (Figure 6C).
It has been shown that telomerase can be activated as a mechanism to bypass ‘crisis’, a stage when telomere erosion and genomic instability occur in cells (26). We next determined average telomere length in the IMR90-M and the IMR90-T cells. Notably, the telomere length assay detected no apparent shortening of the average telomere length in IMR90-P cells, IMR90-M cells or IMR90-T cells, compared with normal early passage IMR90 fibroblasts (Figure 6D). These results suggest that activation of telomerase in the IMR90-M cells is unlikely triggered by critically short telomere length or ‘crisis’.
Silencing of c-Myc leads to downregulation of hTERT expression in spontaneously transformed IMR90-M cells
To investigate whether the aberrant expression of c-Myc in IMR90-M cells contributed to the observed increased expression and activity of hTERT in these cells, we used RNA interference to knockdown Myc expression in IMR90-M cells. Transient transfection of IMR90-M cells with a selective siRNA for c-Myc resulted in a ~50% knockdown of expression of the target gene whereas a negative control siRNA exhibited little effect (Figure 7). Interestingly, downregulation of c-Myc expression in IMR90-M cells is associated with the downregulation of hTERT expression (Figure 7). These data are consistent with previous reports showing that c-Myc transcriptionally activates expression of hTERT (24,25). However, we cannot rule out the possibility that other genetic changes in IMR90-M cells might have also contributed to the upregulation of hTERT.
Fig. 7.
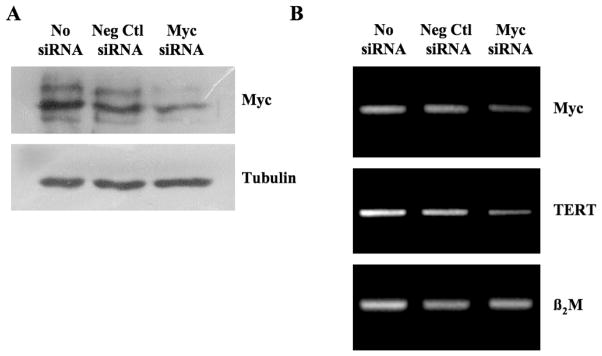
siRNA-mediated silencing of c-Myc expression led to the downregulation of hTERT in IMR90-M cells. IMR90-M cells were transiently transfected with 200 nM of Silencer c-myc siRNA or Silence Negative control siRNA and collected 24 h later for western blot analysis (A) or RT–PCR analysis (B).
Stable expression of c-Myc or hTERT is sufficient to transform normal IMR90 fibroblasts to a tumorigenic state in cooperation with E1A and H-RasV12
We further investigated the roles of c-Myc and hTERT in the neoplastic transformation of IMR90 cells. For this, we compared whether overexpression of c-Myc or hTERT is sufficient to cooperate with E1A and Ras to transform normal human diploid IMR90 fibroblasts. Early passage IMR90 fibroblasts were transduced via retroviral gene transfer with E1A and Ras (co-expressed on a retroviral vector) followed by a subsequent transduction of c-Myc, hTERT or an empty vector. Following drug selection, IMR90 cells stably transduced with E1A, Ras and c-Myc (E1A/Ras/Myc), or E1A, Ras and hTERT (E1A/Ras/hTERT), or control (E1A/Ras) were tested for tumorigenicity in vivo. As a positive control, the IMR90-M cells were similarly analyzed in parallel. 0Consistent with our previous findings, all mice injected with the IMR90-M cells developed tumors (10/10). Significantly, 7 of the 10 mice injected with the E1A/Ras/Myc-expressing cells developed tumors (Table I), although the average latency period in the mice injected with E1A/Ras/Myc-expressing cells was longer compared with that in the mice injected with the IMR90-M cells (Figure 8). In addition, 5 of the 10 mice injected with E1A/Ras/hTERT-expressing cells also developed tumors (Table I), although the average latency period was even longer than that of either IMR90-M or E1A/Ras/Myc (Figure 8B). Again, none of the mice injected with the E1A/Ras-expressing cells developed tumors (Table I). In all groups, the cells derived from the subcutaneous tumors exhibited phenotypes indistinguishable from the cells prior to the injection (data not shown). Expression of hTERT and telomerase activity was also confirmed in the tumor-derived cells (Figure 9). Finally, immunohistochemical analyses showed that the tumors derived from mice stained positive for vimentins but not for pan-keratins, indicating that these tumors are indeed fibrosarcomas (data not shown). Taken together, our studies suggest that aberrant expression of c-Myc and hTERT, potentially as a result of the chromosomal rearrangements, might have contributed to the tumorigenicity of the IMR90-M cells.
Fig. 8.
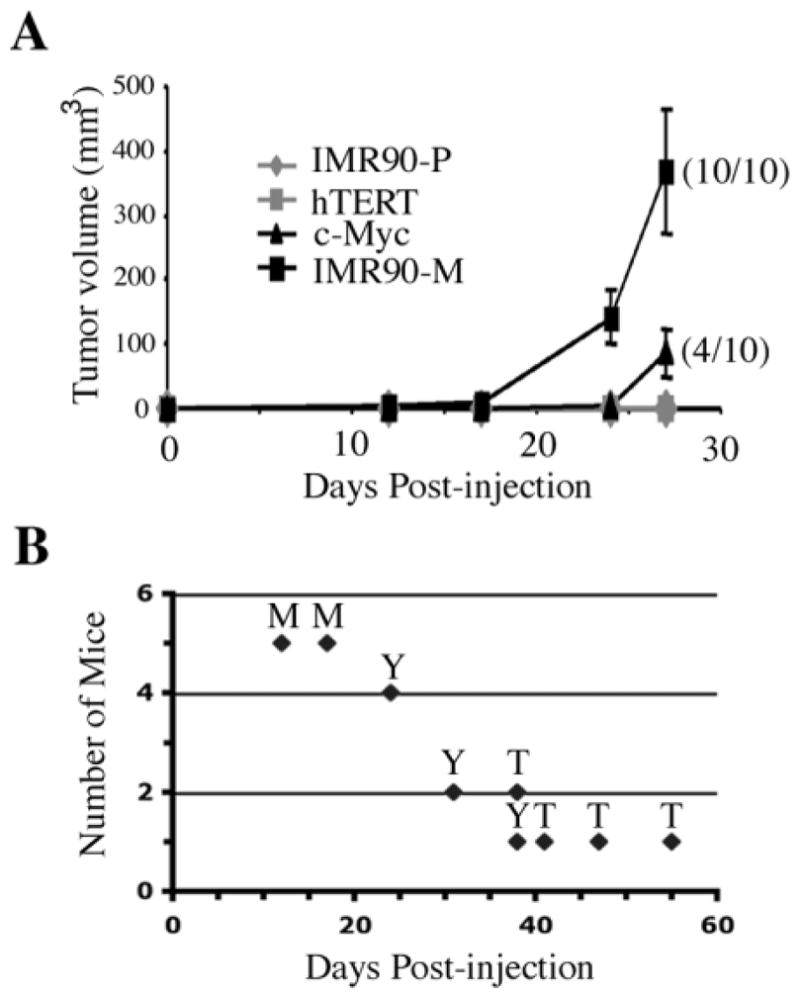
IMR90 cells transduced with E1A, Ras and c-Myc were tumorigenic in scid mice. (A) In vivo tumor assay of the indicated cell types. IMR90-P: IMR90 cells expressing E1A and Ras. hTERT: IMR90 cells transduced with E1A, Ras and hTERT. c-Myc: IMR90 cells transduced with E1A, Ras and c-Myc. IMR90-M: spontaneously transformed E1A/Ras-expressing IMR90 cells. Ten mice received subcutaneous injections of 1.1 × 10⁷ cells in 200 μl PBS. Every 4–6 days, the tumor volume was measured using calipers. Compared with the IMR90-P group that never formed tumors during the 76 days of the experiment all mice bearing IMR90-M cells formed palpable tumors between 12 and 17 days post-inoculation. Mice bearing IMR90-E1A/Ras/Myc cells formed palpable tumors in 70% of cases between days 24 and 38 post-inoculation. Mice bearing IMR90-E1A/Ras//hTERT cells formed palpable tumors in only 50% of cases and at a drastically reduced rate (between days 38 and 55 post-inoculation). Primary subcutaneous tumors were carefully examined for signs of invasion and surgically removed for further analysis. Note: the shown graph contains data collected up to 27 days post-injection. At this point, only 4 of the 10 mice injected with the E1A/Ras/Myc mice had developed tumors (4/10). The remaining mice in the experiment were monitored for an additional 18 days (end-point), and the total number of tumors developed in this experiment is shown in Table I (Experiment 3). (B) Tumor onset time of mice injected with IMR90-M cells (M), IMR90-E1A/Ras/Myc cells (Y) or IMR90-E1A/Ras/hTERT cells (T).
Fig. 9.
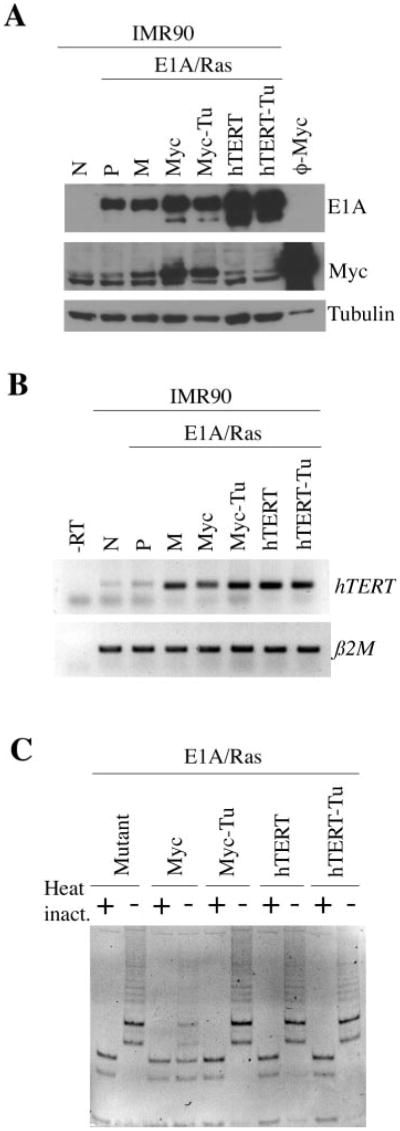
Expression of hTERT and upregulation of telomerase activity in cells transduced with c-Myc or hTERT. (A) Western blot analysis of E1A and c-Myc in the indicated cell types. Pheonix cells transduced with c-Myc (ϕ-Myc) were used as a positive control for c-Myc expression. Expression of α-tubulin was used as a protein loading control. (B) RT–PCR analysis of hTERT expression in the indicated cell types. β2 microglobulin (β2M) was used as a loading control for total RNA. The negative control is the reaction without reverse transcriptase (-RT). N: normal IMR90 cells. P: IMR90-P cells. M: IMR90-M cells. Tu: the tumor-derived cells. (C) Telomerase activity assay of the indicated cell types. Heat inactivation was used as a negative control.
Discussion
Human cells are known to be more refractory to oncogenic transformation in vitro than their rodent counterparts (1,2). To date, the molecular mechanisms underlying such resistance remain largely unknown. Studies on the number and nature of the genetic changes that are required to convert a normal human cell into a tumor cell suggest that full neoplastic transformation can be achieved by inactivation of the pRb and p53 tumor suppressor pathways coupled to expression of an activated Ras oncogene and elevated levels of Myc (10,27). In most cases, there is an additional need to express hTERT to allow the cells to bypass telomere-mediated growth arrest (23–25). Conversely, E1A/Ras/Mdm2 expression is capable of transforming various human fibroblasts in the absence of telomerase activation (12). SV40 ER/Ras/hTERT co-expression can transform several human cell lines, including normal human BJ fibroblasts, kidney epithelial cells and mammary epithelial cells (10–11). Neoplastic transformation of human kidney epithelial cells by SV40 ER/Ras/hTERT occurs in the absence of extensive aneuploidy, chromosomal translocations and microsatellite instability (28). In contrast, Akagi et al. (27) showed that SV40 ER/Ras/hTERT co-expression is sufficient to result in aneuploidy and neoplastic transformation of IMR90 and BJ fibroblasts, but not of TIG-1 and TIG-3 fibroblasts. These studies suggest that genomic instability is highly associated with successful neoplastic transformation of normal human cells although it is not necessarily required in some cases (27,28). Our studies provide additional evidence that neoplastic transformation of human cells was associated with genomic instability.
Cellular malignancy commonly arises as a consequence of accumulated genetic alterations in the cells. These alterations involve inactivation of the apoptotic pathways or gain of self-sufficiency in growth signals (29). The IMR90-M cells described in the present study have obviously gained specific genetic changes that might have contributed to aberrant growth potential, although, we are unable to rule out the possibility that evasion of apoptosis also contributes to the tumorigenicity of these cells.
The tumor cells derived from mice injected with the IMR90-M cells (i.e. IMR90-T cells) maintained t(7;8) and t(5;17) translocations. While we cannot rule out the possibility that IMR90-M cells might represent derivatives of a single tumorigenic clone that happened to have sustained these translocations, the genetic changes associated with these translocations may causally account for the tumorigenic potential acquired by the IMR90-M cells. Yet, the observed differential rates of tumor development by the IMR90-M cells may reflect genetic heterogeneity of the cell population. Indeed, while the majority of the metaphase spreads analyzed by SKY revealed two chromosomal translocation events in the IMR90-M and IMR90-T cells, some cells exhibited only the chromosomal t(7;8) translocation. Therefore, it remains possible that the tumors with extended latency contain more cells with only the single chromosomal t(7;8) translocation. Consistent with this notion, the c-Myc gene is localized at chromosome 8q24 and cells transduced with E1A/Ras/Myc were also tumorigenic, but exhibited delayed tumor development compared with the IMR90-M cells. Activation of the c-Myc gene through chromosomal translocations or gene amplification occurs in various types of human cancers (23). In this view, it is possible that chromosomal t(7:8) translocation results in Myc overexpression which contributes to the tumorigenicity on the IMR90-M cells, and the additional chromosomal t(5;17) translocation further enhances the tumorigenicity of these cells.
An alternative explanation for the delayed tumor onset of cells transduced with E1A/Ras/Myc is that the ectopic expression of c-Myc rendered cells more susceptible to apoptosis, hence delaying the tumor growth when compared with the IMR90-M cells. Indeed, the apoptotic function of c-Myc has been well studied (30,31), and we have noticed increased spontaneous cell death occurring in the cells upon the transduction of c-Myc (data not shown). Studies have shown that c-Myc can activate telomerase (24), which is upregulated in >80% of the human tumors examined (32). It is believed that telomerase can contribute to tumorigenesis by both telomere-length dependent and telomere-length independent mechanisms (12,33–37). Consistent with its role in tumorigenesis, we show for the first time that hTERT can work synergistically with E1A and Ras to transform normal human IMR90 fibroblasts. Our data suggest however that Myc and hTERT are not equivalent in their ability to transform cells. Indeed, E1A/Ras/Myc- and E1A/Ras/hTERT-expressing IMR90 cells manifest very different rates of tumor take/growth. Our data further underscore the increased transformation potential of Myc over hTERT, which is consistent with previous studies on rat embryonic fibroblasts, suggesting that the transforming activities of Myc extend beyond its ability to activate TERT gene expression and hence telomerase activity (25).
In conclusion, we have derived and characterized a spontaneously transformed human fibroblast line. Our studies identified specific genetic alterations that are associated with the tumorigenicity of the spontaneously transformed cells. Our data suggest that overexpression of c-Myc and its subsequent activation of hTERT are associated with the tumorigenicity of IMR90-M cells. Lastly, we report additional successful neoplastic transformation of normal human IMR90 lung fibroblasts by defined genetic elements.
Acknowledgments
The authors thank Dr M. Kimura (RPCI) and Dr M. Narita (Cold Spring Harbor Laboratory) for helpful discussions during the preparation of this manuscript. The authors also thank Dr C. Porter and Dr J. Black for critically reading and for helpful comments on this manuscript. This work was supported by the Roswell Park Cancer Center Core Grant CA16056, the American Cancer Society Institutional Research Grant 58100501 (A.L.) and an Insight Award to Stamp out Breast Cancer from NCI R21 CA9124785 (D.K.). Y.R.S. was supported by a pre-doctoral fellowship from the U.S. Army Breast Cancer Research Program (DAMD 17-01-1-0210).
Abbreviations
- CGH-BAC
comparative genomic hybridization analysis using arrays (aCGH) of bacterial artificial chromosomes (BAC)
- SKY
Spectral karyotyping
- scid mice
severe combined immunodeficient mice
Footnotes
Conflict of Interest Statement: None declared.
References
- 1.Hahn WC, Weinberg RA. Rules for making human tumor cells. N Engl J Med. 2002;347:1593–1603. doi: 10.1056/NEJMra021902. [DOI] [PubMed] [Google Scholar]
- 2.Vogelstein B, Kinzler KW. Cancer genes and the pathways they control. Nat Med. 2004;10:789–799. doi: 10.1038/nm1087. [DOI] [PubMed] [Google Scholar]
- 3.Campisi J. Cancer and ageing: rival demons? Nat Rev Cancer. 2003;3:339–349. doi: 10.1038/nrc1073. [DOI] [PubMed] [Google Scholar]
- 4.Bodnar AG, Ouellette M, Frolkis M, Holt SE, Chiu CP, Morin GB, Harley CB, Shay JW, Lichtsteiner S, Wright WE. Extension of life-span by introduction of telomerase into normal human cells. Science. 1998;279:349–352. doi: 10.1126/science.279.5349.349. [DOI] [PubMed] [Google Scholar]
- 5.Soloff MS, Jeng YJ, Ilies M, Soloff SL, Izban MG, Wood TG, Panova NI, Velagaleti GV, Anderson GD. Immortalization and characterization of human myometrial cells from term-pregnant patients using a telomerase expression vector. Mol Hum Reprod. 2004;10:685–695. doi: 10.1093/molehr/gah086. [DOI] [PubMed] [Google Scholar]
- 6.Bai Y, Hu Q, Li X, Wang Y, Lin C, Shen L, Li L. Telomerase immortalization of human neural progenitor cells. Neuroreport. 2004;15:245–549. doi: 10.1097/00001756-200402090-00006. [DOI] [PubMed] [Google Scholar]
- 7.Xiaoxue Y, Zhongqiang C, Zhaoqing G, Gengting D, Qingjun M, Shenwu W. Immortalization of human osteoblasts by transferring human telomerase reverse transcriptase gene. Biochem Biophys Res Commun. 2004;315:643–651. doi: 10.1016/j.bbrc.2004.01.102. [DOI] [PubMed] [Google Scholar]
- 8.Noble JR, Zhong ZH, Neumann AA, Melki JR, Clark SJ, Reddel RR. Alterations in the p16(INK4a) and p53 tumor suppressor genes of hTERT-immortalized human fibroblasts. Oncogene. 2004;23:3116–3121. doi: 10.1038/sj.onc.1207440. [DOI] [PubMed] [Google Scholar]
- 9.Hahn WC. Immortalization and transformation of human cells. Mol Cells. 2002;13:351–361. [PubMed] [Google Scholar]
- 10.Hahn WC, Counter CM, Lundberg AS, Beijersbergen RL, Brooks MW, Weinberg RA. Creation of human tumour cells with defined genetic elements. Nature. 1999;400:464–468. doi: 10.1038/22780. [DOI] [PubMed] [Google Scholar]
- 11.Elenbaas B, Spirio L, Koerner F, Fleming MD, Zimonjic DB, Donaher JL, Popescu NC, Hahn WC, Weinberg RA. Human breast cancer cells generated by oncogenic transformation of primary mammary epithelial cells. Genes Dev. 2001;15:50–65. doi: 10.1101/gad.828901. [DOI] [PMC free article] [PubMed] [Google Scholar]
- 12.Seger YR, Garcia-Cao M, Piccinin S, Cunsolo CL, Doglioni C, Blasco MA, Hannon GJ, Maestro R. Transformation of normal human cells in the absence of telomerase activation. Cancer Cell. 2002;2:401–413. doi: 10.1016/s1535-6108(02)00183-6. [DOI] [PubMed] [Google Scholar]
- 13.Ruley HE. Adenovirus early region 1A enables viral and cellular transforming genes to transform primary cells in culture. Nature. 1983;304:602–606. doi: 10.1038/304602a0. [DOI] [PubMed] [Google Scholar]
- 14.Lin AW, Barradas M, Stone JC, van Aelst L, Serrano M, Lowe SW. Premature senescence involving p53 and p16 is activated in response to constitutive MEK/MAPK mitogenic signaling. Genes Dev. 1998;12:3008–3019. doi: 10.1101/gad.12.19.3008. [DOI] [PMC free article] [PubMed] [Google Scholar]
- 15.Serrano M, Lin AW, McCurrach ME, Beach D, Lowe SW. Oncogenic ras provokes premature cell senescence associated with accumulation of p53 and p16INK4a. Cell. 1997;88:593–602. doi: 10.1016/s0092-8674(00)81902-9. [DOI] [PubMed] [Google Scholar]
- 16.Matsui S, Sait S, Jones CA, Nowak N, Gross KW. Rapid localization of transgenes in mouse chromosomes with a combined spectral karyotyping/FISH technique. Mamm Genome. 2002;13:680–685. doi: 10.1007/s00335-002-2197-0. [DOI] [PubMed] [Google Scholar]
- 17.Matsui S, Faitar SL, Rossi MR, Cowell JK. Application of spectral karyotyping to the analysis of the human chromosome complement of interspecies somatic cell hybrids. Cancer Genet Cytogenet. 2003;142:30–35. doi: 10.1016/s0165-4608(02)00730-6. [DOI] [PubMed] [Google Scholar]
- 18.Cowel JK, Nowak NJ. High-resolution analysis of genetic events in cancer cells using bacterial artificial chromosome arrays and comparative genome hybridization. Adv Cancer Res. 2003;90:91–125. doi: 10.1016/s0065-230x(03)90003-0. [DOI] [PubMed] [Google Scholar]
- 19.Cowell JK, Matsui S, Wang YD, LaDuca J, Conroy J, McQuaid D, Nowak NJ, Head K. Application of bacterial artificial chromosome array-based comparative genomic hybridization and spectral karyotyping to the analysis of glioblastoma multiforme: identification and characterisation of constitutional chromosome abnormalities using arrays of bacterial artificial chromosomes. Cancer Genet Cytogenet. 2004;151:36–51. doi: 10.1016/j.cancergencyto.2003.09.012. [DOI] [PubMed] [Google Scholar]
- 20.Lowe SW, Ruley HE, Jacks T, Housman DE. p53-dependent apoptosis modulates the cytotoxicity of anticancer agents. Cell. 1993;74:957–967. doi: 10.1016/0092-8674(93)90719-7. [DOI] [PubMed] [Google Scholar]
- 21.Jacks T, Weinberg RA. Taking the study of cancer cell survival to a new dimension. Cell. 2002;111:923–925. doi: 10.1016/s0092-8674(02)01229-1. [DOI] [PubMed] [Google Scholar]
- 22.Cowell JK, Barnett GH, Nowak NJ. Characterization of the 1p/19q chromosomal loss in oligodendrogliomas using comparative genomic hybridization arrays (CGHa) J Neuropathol Exp Neurol. 2004;63:151–158. doi: 10.1093/jnen/63.2.151. [DOI] [PubMed] [Google Scholar]
- 23.Pelengaris S, Khan M, Evan G. c-MYC: more than just a matter of life and death. Nat Rev Cancer. 2002;2:764–776. doi: 10.1038/nrc904. [DOI] [PubMed] [Google Scholar]
- 24.Wang J, Xie LY, Allan S, Beach D, Hannon GJ. Myc activates telomerase. Genes Dev. 1998;12:1769–1774. doi: 10.1101/gad.12.12.1769. [DOI] [PMC free article] [PubMed] [Google Scholar]
- 25.Greenberg RA, O’Hagan RC, Deng H, Xiao Q, Hann SR, Adams RR, Lichtsteiner S, Chin L, Morin GB, DePinho RA. Telomerase reverse transcriptase gene is a direct target of c-Myc but is not functionally equivalent in cellular transformation. Oncogene. 1999;18:1219–1226. doi: 10.1038/sj.onc.1202669. [DOI] [PubMed] [Google Scholar]
- 26.Sharpless NE, DePinho RA. Telomeres, stem cells, senescence, and cancer. J Clin Invest. 2004;113:160–168. doi: 10.1172/JCI20761. [DOI] [PMC free article] [PubMed] [Google Scholar]
- 27.Akagi T, Sasai K, Hanafusa H. Refractory nature of normal human diploid fibroblasts with respect to oncogene-mediated transformation. Proc Natl Acad Sci USA. 2003;100:13567–13572. doi: 10.1073/pnas.1834876100. [DOI] [PMC free article] [PubMed] [Google Scholar]
- 28.Zimonjic D, Brooks MW, Popescu N, Weinberg RA, Hahn WC. Derivation of human tumor cells in vitro without widespread genomic instability. Cancer Res. 2001;61:8838–8844. [PubMed] [Google Scholar]
- 29.Blagosklonny MV. Cell immortality and hallmarks of cancer. Cell Cycle. 2003;2:296–299. [PubMed] [Google Scholar]
- 30.Nilsson JA, Cleveland JL. Myc pathways provoking cell suicide and cancer. Oncogene. 2003;22:9007–9021. doi: 10.1038/sj.onc.1207261. [DOI] [PubMed] [Google Scholar]
- 31.Secombe J, Pierce SB, Eisenman RN. Myc: a weapon of mass destruction. Cell. 2004;117:153–156. doi: 10.1016/s0092-8674(04)00336-8. [DOI] [PubMed] [Google Scholar]
- 32.Greider CW, Blackburn EH. Tracking telomerase. Cell. 2004;116:S83–S86. doi: 10.1016/s0092-8674(04)00053-4. 1 p following S86. [DOI] [PubMed] [Google Scholar]
- 33.Hastie ND, Dempster M, Dunlop MG, Thompson AM, Green DK, Allshire RC. Telomere reduction in human colorectal carcinoma and with ageing. Nature. 1990;346:866–868. doi: 10.1038/346866a0. [DOI] [PubMed] [Google Scholar]
- 34.Chang S, DePinho RA. Telomerase extracurricular activities. Proc Natl Acad Sci USA. 2002;99:12520–12522. doi: 10.1073/pnas.212514699. [DOI] [PMC free article] [PubMed] [Google Scholar]
- 35.Blasco MA. Mammalian telomeres and telomerase: why they matter for cancer and aging. Eur J Cell Biol. 2003;82:441–446. doi: 10.1078/0171-9335-00335. [DOI] [PubMed] [Google Scholar]
- 36.Shay JW, Wright WE. Telomerase: a target for cancer therapeutics. Cancer Cell. 2002;2:257–265. doi: 10.1016/s1535-6108(02)00159-9. [DOI] [PubMed] [Google Scholar]
- 37.Cech TR. Beginning to understand the end of the chromosome. Cell. 2004;116:273–279. doi: 10.1016/s0092-8674(04)00038-8. [DOI] [PubMed] [Google Scholar]