
Figure 1. Expression of miR-34 is correlated with p53 status in MEFs.
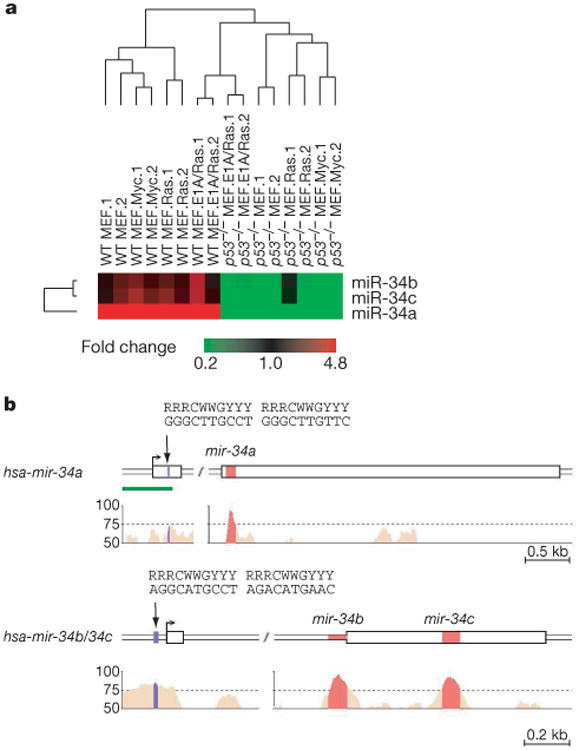
a, An unsupervised hierarchical clustering based on miRNA expression profiles in wild-type and p53−/− MEFs with the indicated additional genetic alteration. Two independently constructed cell lines (.1 and .2) were analysed in each case. The complete heat map (linear scale) is presented in Supplementary Fig. S1. b, Predicted gene structures for human mir-34a and mir-34b/c were generated by combining information from expressed sequence tag databases, CAGE databases and 5′ rapid amplification of cDNA ends. Sequence conservation between human, mouse and rat are represented as the percentage of conservation in the Vista analysis shown in the lower panel. The promoter regions of mir-34a and mir-34b/c each contain a palindromic sequence (shown in blue) that matches the canonical p53 binding site. The green bar indicates a CpG island. kb, kilobase.