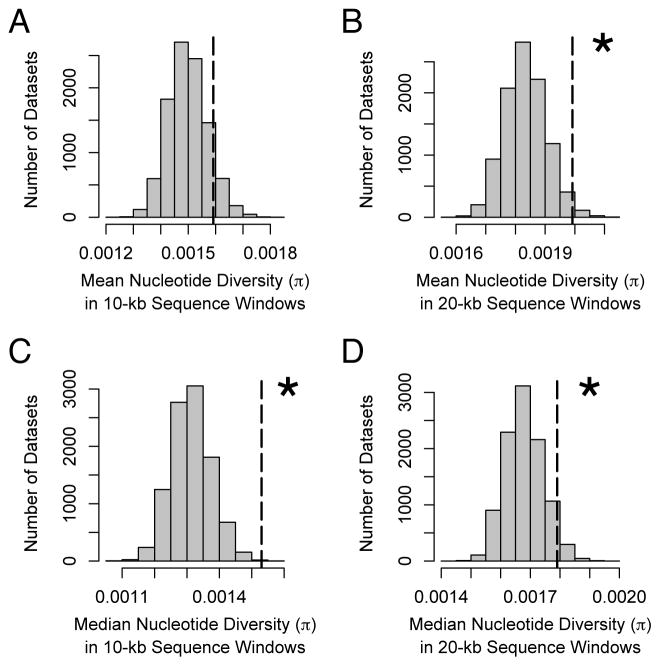
Figure 2. Comparison of polymorphism in regions surrounding candidate loci compared to the rest of the genome.
Dotted lines show the mean or median nucleotide diversity in sequence windows of 10- or 20-kb compared to the null distribution based on 10,000 data sets of the same size where sequence windows were chosen randomly. Asterisks indicate statistically significant results. (A) Mean nucleotide diversity in 10-kb sequence windows, (B) mean nucleotide diversity in 20-kb sequence windows, (C) median nucleotide diversity in 10-kb sequence windows, and (D) median nucleotide diversity in 20-kb sequence windows.

