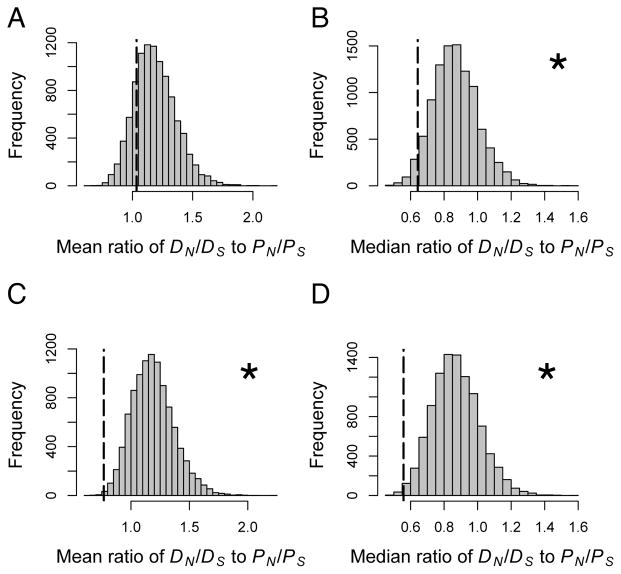
Figure 3. McDonald-Kreitman tests.
Histograms show the mean or median ratio of DN/DS to PN/PS for 10,000 randomly generated gene sets, and the dotted line shows the observed value of this ratio for candidate genes. Asterisks indicate statistically significant results. (A) Mean ratio, (B) median ratio, (C and D) mean and median ratios after removing two candidate genes with extreme values. See text for details.

