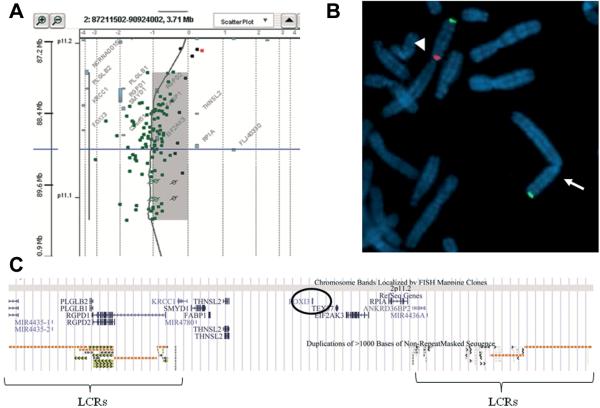
Figure 3.
Results of array-CGH and FISH analyses: A) Array-CGH analysis shows an interstitial deletion ~2.474 Mb at band 2p11.2 of chromosome 2. The deleted region extends between oligomers probe A_16_P00422994 (87,790,841 bp) to probe A_18_P13306010 (90,265,119 bp) flanking by probe A_18_P13304801 (87,776,265 bp) and probe A_16_P00424442 (91,693,395 bp) (Feb. 2009 (GRCh37/hg19) Assembly). The deleted region is flanked by large complex LCR clusters on chromosome 2 at p11.2 distal LCR (chr2:87,730,959–88,320,829) and proximal LCR (1.210 Mb, chr2:89,055,232–90,265,886). B) FISH experiment was performed with probes RP11-525L16 (FOXI3) (red signal) and a subtelomeric probe dj892G20 (green signal); arrow indicates the deleted chromosome 2 and arrowhead the normal chromosome 2. C) Extract from the UCSC genome browser (http://genome.ucsc.edu/) GRCh37/hg19 shows the deleted region of our patient and its gene content, including the FOXI3 locus (circled).

