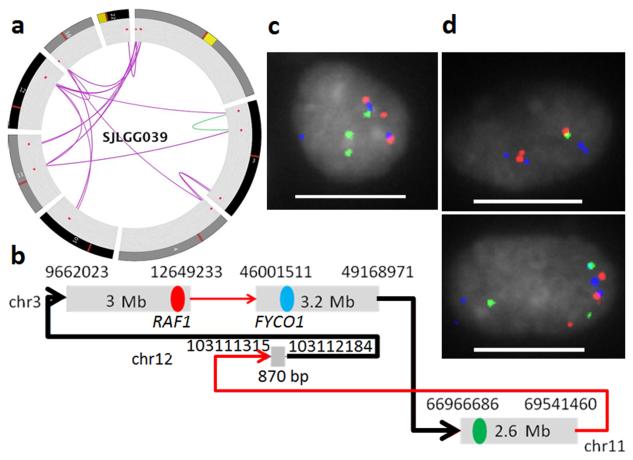
Figure 3.
A complex re-arrangement in a pediatric low grade glioma sample identified by CONSERTING. (a) Circos plot of 8 chromosomes (1, 3, 4, 10, 11, 12, 16 and 22) with inter-chromosomal SVs (purple lines) and intrachromosomal SVs (green lines) connecting the amplification CNAs (red dots). (b) SV graph constructed from CNAs and SVs identified on chromosomes 3, 11 and 12. The black lines indicate SVs detected only by CONSERTING. The red, blue and green dots mark the three BAC clones selected for FISH assay. The SV represented by red-blue fusion represents an in-frame FYCO1-RAF1 fusion. (c) Red, green, blue fusion signal found in 36% of the nuclei. d) Various 2-color fusion signals including red-blue fusion and red-green fusion (scale bar: 10 μm).

