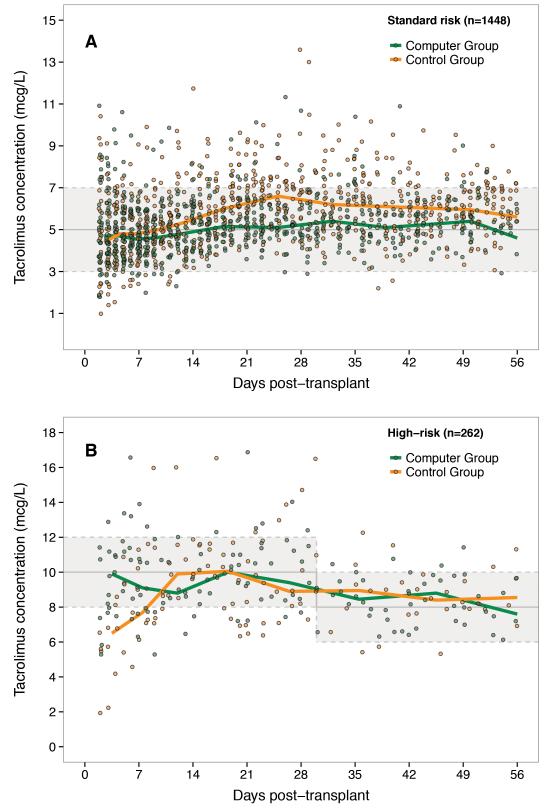
Figure 1.
Observed tacrolimus trough concentrations in the Computer Group and Control Group over time after transplantation in A) standard risk patients and B) high-risk patients. Solid lines show the median concentration. Shaded areas represent the target range. Solid gray line represents the middle of the target range.

