
Fig. 6. M2 microglia/macrophage polarization after dMCAO in young and aged mice.
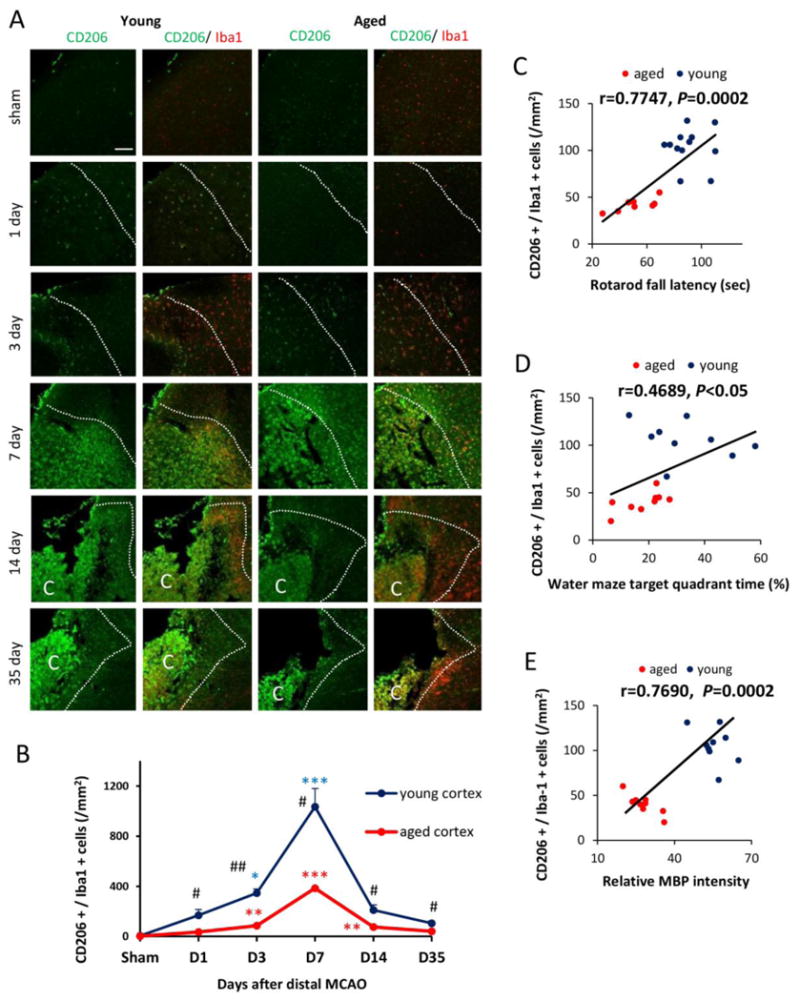
A. Representative images of CD206 (M2 marker; green) and Iba1 (red) double staining at 1, 3, 7, 14, and 35d after dMCAO or in sham-operated animals. Dotted line designates the infarct borderline. Scale bar: 120 μm. B. Quantification of the number of CD206+Iba1+ cells in the ischemic border zone in young adult and aged mice. Values are means ± SEM. n=4 per group. *p≤0.05, **p≤0.01, ***p≤0.001, vs corresponding sham. # p≤0.05, ## p≤0.01 young vs aged. C-D. Pearson correlation between the number of M2 cells and behavioral performance on the Rotarod or Morris water maze memory tests. C. There was a positive correlation between the number of M2 microglia/macrophage and Rotarod performance at 35d after dMCAO. D. There was a positive correlation between the number of M2 microglia/macrophage and water maze performance at 21d after dMCAO. E. There was a positive correlation between the number of M2 microglia/macrophage and MBP staining intensity at 35d after dMCAO.