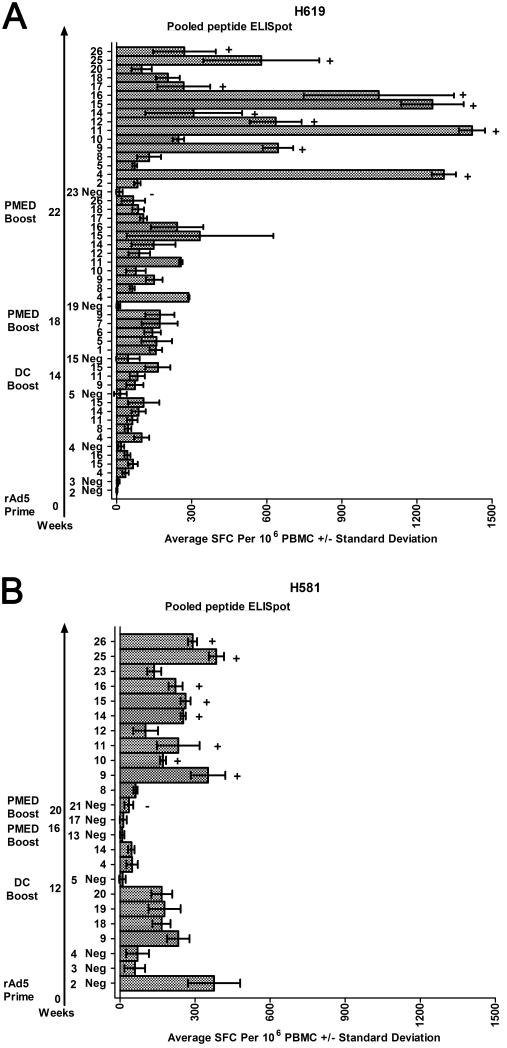
Figure 3.
Pooled peptide ELISpot results tracking an immune response to the encoded disparities following the vaccine series for H619 (A) and H581 (B). DMSO-negative (Neg) controls are shown for each time point tested. Only positive peptide pools are shown following the DMSO-negative control from that time point and defined as greater than 50 spot-forming cells (SFC) per 106 PBMCs on average, with non-overlapping standard deviations with the DMSO-negative control. The arrow plots out the time in weeks following the prime and boost vaccinations and the subsequent pooled peptide ELISpot assays. Specific pools underwent ICS confirmation. A plus sign (+) indicates a positive ICS response and a minus sign (−) indicates a negative ICS response (ICS examples shown in Figure 4 and data listed in Table 2).

