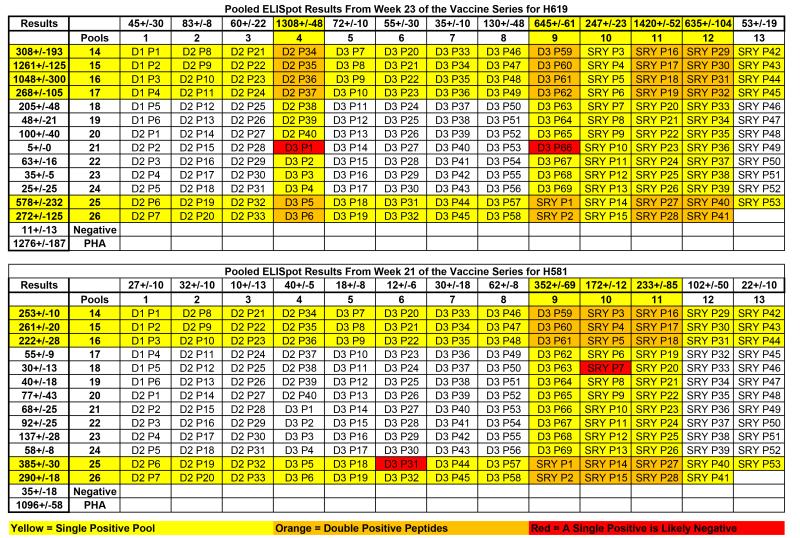
Figure 5.
ELISpot results from week 23 for H619 (Top), and week 21 for H581 (Bottom) are shown in context of the 13 × 13 peptide pool matrix of overlapping 15-mer peptides. Results are expressed as average spot-forming cells per 106 PBMC +/− standard deviation for pools 1-13 across and 14-26 down. The DMSO-negative control and a PHA-positive control were included as a reference. Extremely positive pools are highlighted in yellow. Overlapping peptides that were positive in both arms of the matrix are highlighted in orange and underwent single peptide ELISpot confirmation (see Figure 6). As further validation of the matrix, two peptides that are in a positive peptide pool, but are predicted to be non-responsive due to the presence in a negative pool, are highlighted in red and used as negative peptide controls in the single-peptide ELISpot assays (see Figure 6).

