
Fig. 3.
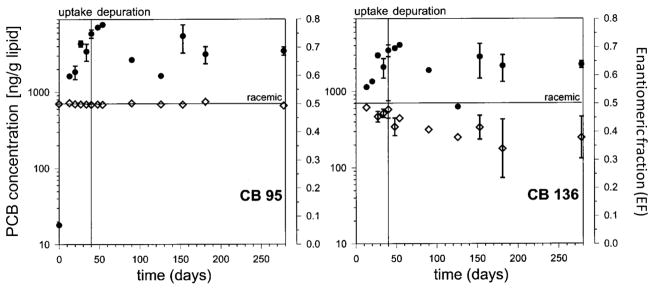
Time-dependent changes in concentration (●) and enantiomeric fractions (◇) of PCB 95 and 136 in rainbow trout carcasses. PCB concentrations are lipid and growth normalized. Each time point represents the mean ± one standard deviation. Reprinted with permission from (Wong et al. 2002a). Copyright 2002, American Chemical Society.