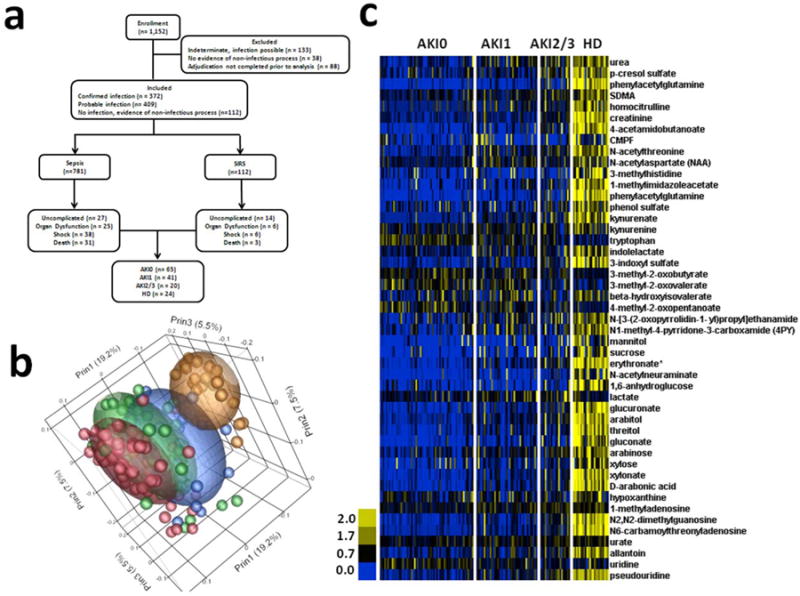
Figure 1.

a) CONSORT diagram for the analyzed cohort. b) PCA with Pearson's product-moment correlation. AKI0 (Red, n = 65); AKI1 (Green, n = 41); AKI2/3 (Blue, n = 20); HD (gold, n = 24). c) Cell plot of representative significant metabolomic changes.
