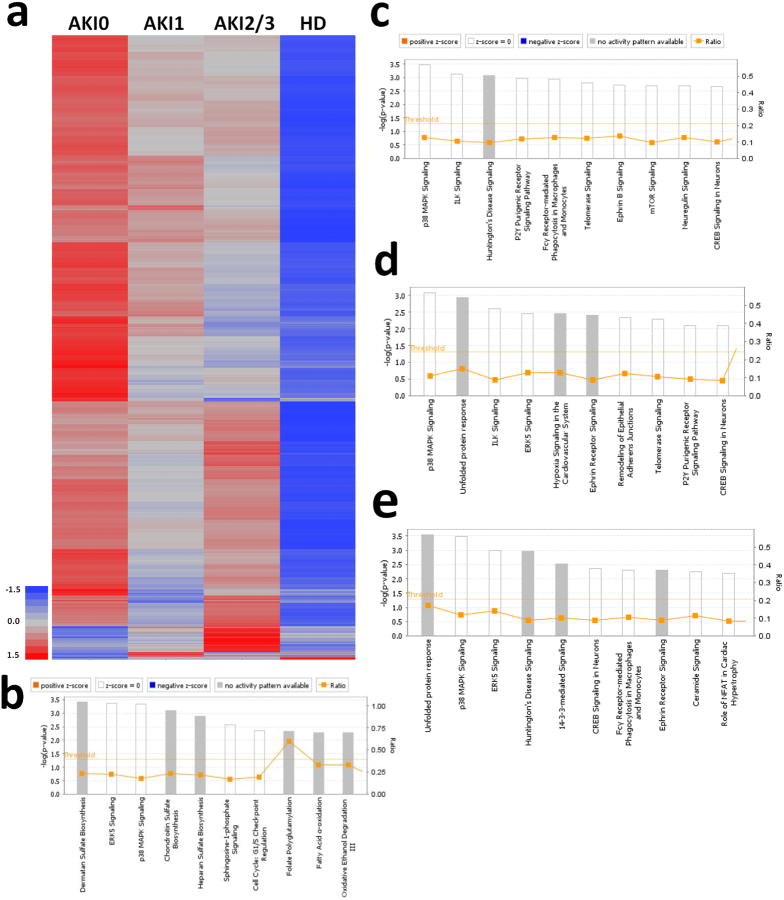
Figure 3. Significant transcriptomic differences.
Heatmap with Pearson's moment-correlations for significantly different gene expression due to decreasing renal function (ANOVAs with 5% FDR correction). 1,997 genes were significantly different from the reference group, AKI0. IPA for top 10 canonical pathways affected by AKI/HD for b) 1,997 significantly different transcripts, c) 1,058 genes correlated with allantoin, d) 949 genes correlated with 4PY and e) 916 genes correlated with NAA.

