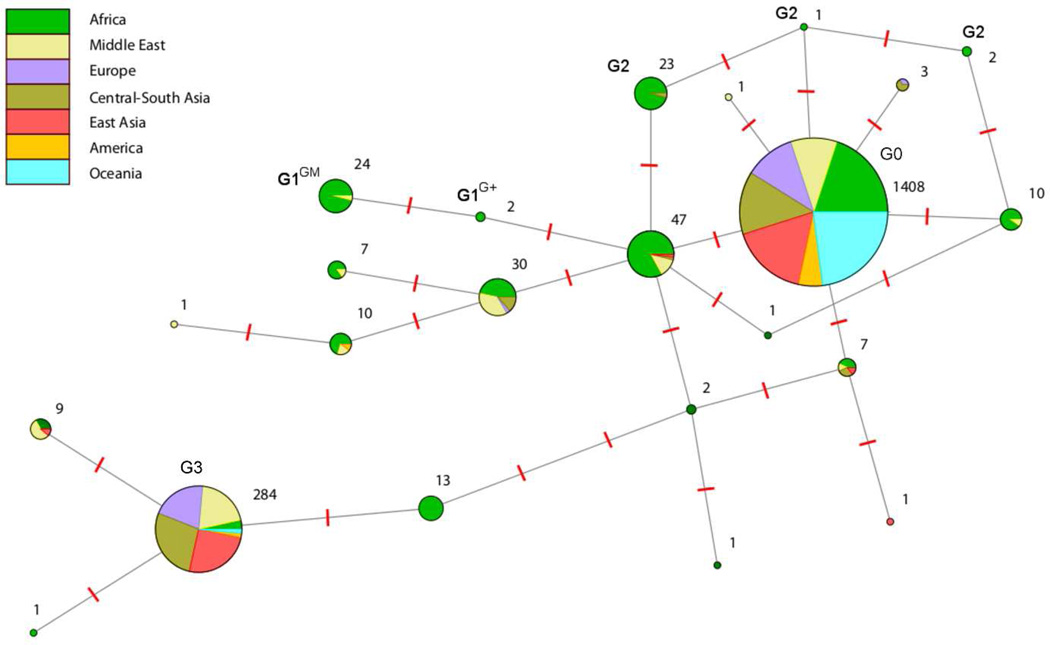
Figure 2. Phylogenetic network for the HGDP APOL1 haplotypes.
Each pie chart represents a haplotype, with the area of the circle a function of the number of haplotypes found in our continental populations (stated next each pie chart). The large separation of G3 from other common haplotypes –indicated by the high number of mutation events (red dashes between two haplotypes)– is consistent with the hypothesis that it was inherited from introgression of archaic populations into modern humans; this is further supported by the fact that it is common in Eurasia but rare in Africa. Correspondingly, G0 plausibly represents the common haplotype in modern humans, common in all continental groups.

