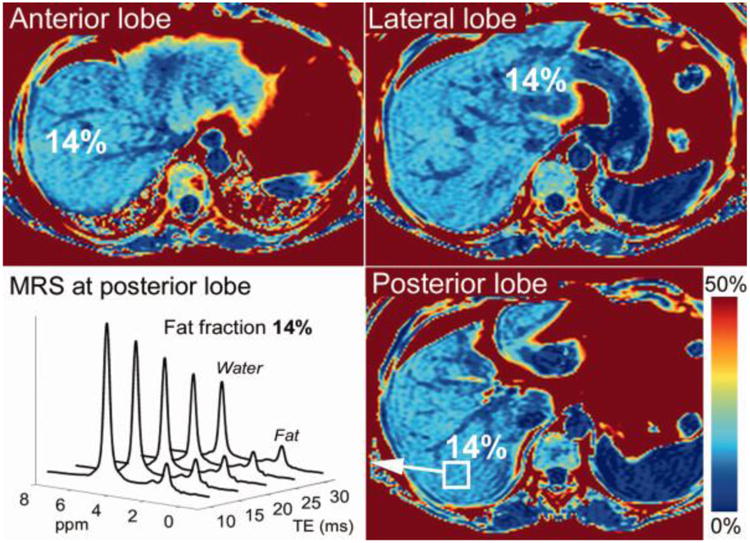
Figure 1.

Example PDFF maps acquired using breath-held CSE-MRI and corresponding MR spectrum acquired in a patient with 14% PDFF. MRI-PDFF values measured in different lobes are shown. MR spectroscopy was performed in the posterior lobe and compared to the imaging results obtained from the ROI placed in the posterior lobe.
