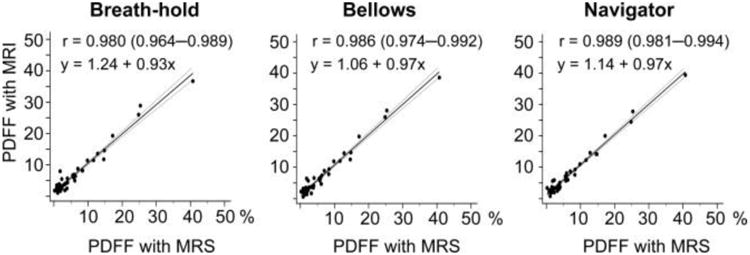
Figure 4.

Excellent correlation and agreement was observed between PDFF measured using MRS and the three CSE-MRI methods. Correlation between fat fractions derived by BH-, BL-, and BV-CSE versus the reference standard MRS. Correlations were all strong with correlation coefficients (r) ranging from 0.986 to 0.980. The equations in the second row represent linear regression.
