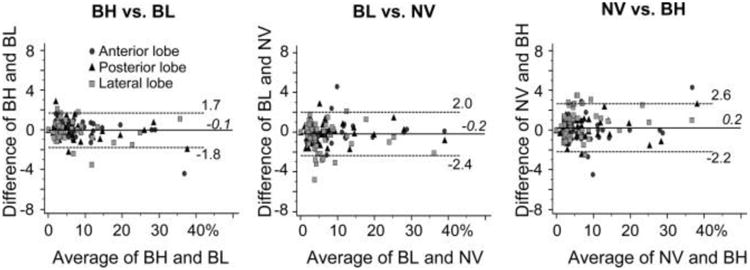
Figure 5.

Bland-Altman plots showing the intraindividual difference in fat fraction between two of the three CSE-MRI techniques with either breath-hold (BH), respiratory-gating with bellows (BL), or navigator echoes (NV). Statistical equalities within ±1 point are shown in each liver lobe (P < 0.046)
