Abstract
Aseptic loosening of cemented joint replacements is a complex biological and mechanical process, and remains a clinical concern especially in patients with poor bone quality. Utilizing high resolution finite element analysis of a series of implanted cadaver glenoids, the objective of this study was to quantify relationships between construct morphology and resulting mechanical stresses in cement and trabeculae.
Eight glenoid cadavers were implanted with a cemented central peg implant. Specimens were imaged by micro-CT, and subject-specific finite element models were developed. Bone volume fraction, glenoid width, implant-cortex distance, cement volume, cement-cortex contact, and cement-bone interface area were measured. Axial loading was applied to the implant of each model and stress distributions were characterized. Correlation analysis was completed across all specimens for pairs of morphological and mechanical variables.
The amount of trabecular bone with high stress was strongly negatively correlated with both cement volume and contact between the cement and cortex (r = −0.85 and −0.84, p < 0.05). Bone with high stress was also correlated with both glenoid width and implant-cortex distance.
Contact between the cement and underlying cortex may dramatically reduce trabecular bone stresses surrounding the cement, and this contact depends on bone shape, cement amount, and implant positioning.
Keywords: Finite element, Implant fixation, Cement morphology, Glenoid implant
Introduction
Aseptic loosening of cemented joint replacements remains a concern in arthroplasty of the hip,1–3 knee,4,5 and shoulder,6–8 especially in patients with poor bone quality and those undergoing revision surgeries. Implant loosening is a multi-faceted biological and mechanical process9,10, and can occur due to failure of the cement or bone-cement interface.11,12 In addition to osteolysis associated with bearing wear debris, mechanical overload of cement or bone may also be a major factor in implant loosening in patients with compromised bone. Clinical and cadaveric studies of cemented shoulder arthroplasty have demonstrated that cementing technique and bone quality likely affects the structural fixation of glenoid.13–17
In 1978, Blacker and Charnely18 suggested removal of proximal trabecular bone for cemented femoral components to improve cement-cortical contact, load bearing capacity and the longevity of implant fixation. Because of inherent difficulties in experimentally measuring internal stress and strain, finite element (FE) computational modeling has been relied upon for quantifying the mechanical environment surrounding implants. Many previous FE studies of joint replacement have reported effects of implant design, implant positioning, and cementing technique on cement and bone stresses.19–23 FE studies of glenoid replacement have reported effects of cement thickness on stresses.24,25 These studies have modeled trabecular bone as a homogeneous continuum, instead of modeling the trabeculae themselves, mainly for computational cost considerations. However such models are not able to predict stresses down to the level of individual trabeculae, and a recent study of uncemented cancellous screws demonstrated errors in bone-implant interface stiffness exceeding 100% when using a continuum assumption.26
More recently investigators have modeled cement-bone interfaces with part of a whole bone structure that included geometries of individual trabeculae determined by micro-CT.27–31 However micro-FE studies of ‘whole-bone’ 3D cemented implant structures are lacking, and models from such studies should lead to better predictions of the effects of implant design and positioning, cement properties, and bone architecture on peri-implant stress and strain. Aseptic loosening is the leading complication in glenoid replacement8, and clinical data13,14,16,17 suggests that glenoid cementing technique affects the incidence and rate of radiographic loosening, and possibly survivorship of the glenoid component. For example Klepps et al.16 reported that patients receiving glenoids with a manually packed cementing technique had increased incidence and thickness of radiolucent lines compared with patients receiving glenoids cemented with a new instrumented pressurization technique. The glenoid’s small size also enables micro-CT imaging of most or all of its structure. The objective of this study was to quantify relationships between construct morphology and resulting stresses in the example of cemented glenoid implant fixation, using micro-CT based FE modeling of eight implanted cadaver specimens. Correlations were determined among a series of morphological variables volumes of bone and cement subject to high stress. Our primary hypothesis was that the amount of contact between the cement and cortex would be correlated to decreases in stresses in surrounding bone and cement.
Methods
Cadaver specimen preparation and imaging
Eight glenoid bone specimens were isolated from fresh-frozen cadaver shoulders without gross anatomical defects or degenerative changes. The specimens were from elderly donors but no additional information was available. Specimens were thawed and cleared of soft tissues. An experienced shoulder surgeon drilled a single 15-mm length, 6 mm diameter central hole perpendicular to the glenoid face. After drilling, the holes were irrigated and dried with gauze. Cement (Simplex P; Stryker, Mahwah, NJ) was injected into the drilled hole with a syringe. Cement was applied until it filled the hole completely, and reapplied up to two times with packing in between applications, randomizing the applied cement amount across specimens. A single 5-mm diameter cylindrical polymer peg was implanted, simulating the center peg of a 3-pegged glenoid implant.
The specimens were micro-CT imaged with a vivaCT 40 (Scanco, Br tisellen, Switzerland) using a 12 μm resolution. The mean insertion depth of implants was approximately 12 mm as measured afterward in image analysis software. A 20.5 mm diameter cylindrical field of view was imaged, centered about the implanted peg. After discrete Gaussian filtering (variance = 1; max kernel width = 1) of the images, bone, cement, and implant were carefully segmented and reconstructed using a semi-automated method, based on thresholding of each material and boolean operations, with Mimics software (Materialise, Belgium).32
Bone and cement morphology analysis
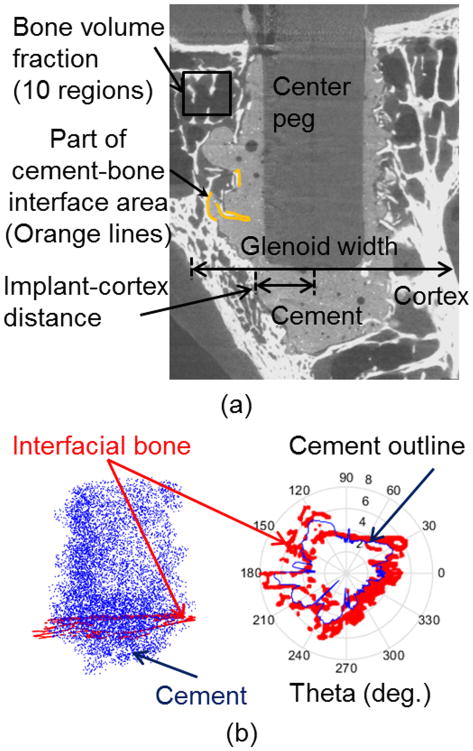
Four 3 mm thick slices were cropped from each specimen. With careful avoidance of cortex, implant, and cement, ten cuboid trabecular regions (3 x 3 x 3 mm3) were randomly selected from the trabecular bone surrounding the cement in each specimen’s micro-CT scan (Fig. 1a). Trabecular bone volume fraction (percentage of bone volume/total volume) was computed using ImageJ (National Institutes of Health) with the bone morphology plugin.33
Figure 1.
(a) Morphological measurements were made from micro-CT images and 3D reconstructed models as shown. (b) The volume of interest for reporting stress results spanned from the bottom of the cement to beneath the subchondral bone, and included bone within 1.5 mm (red) of the cement mantle (blue), determined at each cross section. In the left image the blue dots represent locations of cement voxels (1/50 of total voxels shown), and in the right image, the cement outline is shown at a single axial cross section.
Micro-CT images of the sagittal cross section at the level of the implant bottom were used to measure glenoid width and the shortest implant-cortex distance from the endosteal surface of the cortex to the center of the implant (illustrated in Fig. 1a). The cement volume was calculated from the segmented three-dimensional model (Fig. 1a). The contact area between bone and cement was calculated using the segmented bone and cement masks within the Mimics software based on a previously described method.29,34 Each cement mask was dilated by two pixels (25 μm), and the volume of this resulting mask that intersected the bone mask was normalized by the above dilation thickness.
Amount of contact between cement and cortex along the sides of the glenoid vault (Fig. 1a) was visually graded by four independent observers due to the difficulty in separately modeling cortical and trabecular bone that would be needed for automated three-dimensional quantification. For each specimen nine equally-spaced transverse cross section slices were extracted, and each graded as 1 (with cement cortical contact) or 0 (without). Total values for each specimen were averaged across observers.
Finite Element Modeling
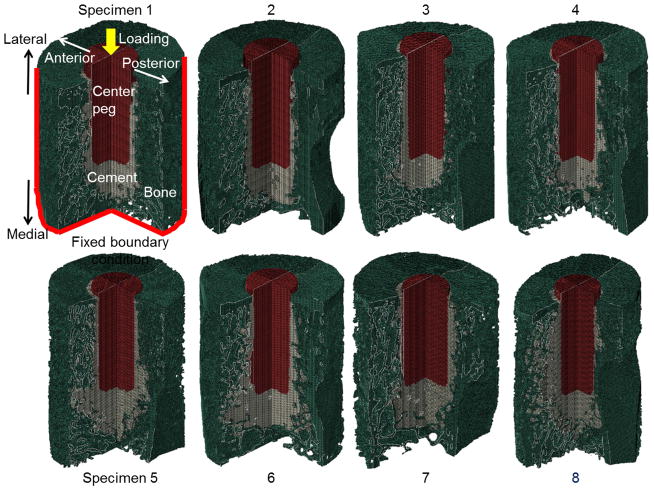
After cropping CT images to a cylinder with 15 mm diameter centered about the implant, FE meshes were generated for each of the eight specimens (Fig. 2). Images were resampled to a 100 μm voxel size (based on mesh convergence tests described below) in all directions and smoothed (4 smoothing iterations and 0.7 smooth factor) in Mimics. A direct voxel-to-element approach was used to generate 3D meshes having 1.2 to 1.9 million hexahedral voxel elements for each model. Linear isotropic material properties were assumed for bone (E = 10 GPa; ν = 0.3),35,36 cement (E = 2.0 GPa; ν = 0.23)24 and UHMWPE (Ultra-high-molecular-weight polyethylene) implant (E = 1.3 GPa; ν = 0.3)19. At regions of contact between implant-cement and cement-bone the interfaces were assumed fully bonded. For boundary conditions, outer walls of bone except for the lateral glenoid face were fixed in space (Fig. 2) to simulate full constraint from the surrounding glenoid bone. Sensitivity to this constraint and the 15 mm dia. diameter modeled region were investigated (Supplementary Material). A force of 376 N was applied medially along the peg axis based on the estimate described below. All simulations were performed with Abaqus 6.13–2 (Simulia, Pawtucket RI) on a 32-core, 1 TB-memory server at our institution’s High Performance Computing Systems. Elements of cement at risk for potential failure were assumed as those having von Mises stresses greater than 7 MPa, which is approximately the tensile fatigue strength of bone cement subject to cyclic loading.37 For trabecular bone 10 MPa was selected for the risk threshold of failure, noting that bone is a heterogeneous, anisotropic nanocomposite material, bone remodels in vivo, and there is uncertainty in the literature as to its failure strength and strain.38,39
Figure 2.
Micro-FE models generated from micro-CT scans of eight different implanted cadaver specimens. Cortical and trabecular bone appears in green, cement in gray, and implant in red. Specimens are ordered according to cement volume (Specimen 1 has lowest volume).
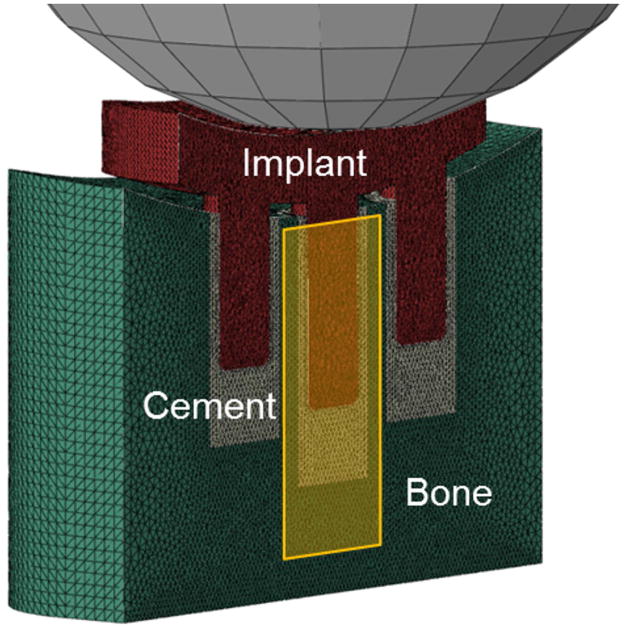
Separately, a macroscopic continuum FE model of a full three-pegged cemented glenoid implant was created in order to estimate the loads applied to the top of the central peg, since the two side pegs will also carry a portion of the load (Fig. 3). The model was based on a previously published one19, except it included cement thickness based on our micro-CT measurements, and a 1-mm gap between the implant’s bearing back surface and lateral bone surface, also consistent with some of our imaged specimens (Supplementary Material, Fig. S-1) and associated with small reaming errors. The model showed that a moderate 500 N glenohumeral centered compressive loading40 produced central peg downward force of 376 N.
Figure 3.
Macroscopic continuum FE model (sectioned in half) used to determine loads transferred to the top of central peg (yellow-shaded region), which were then applied to the eight micro-FE models.
A volume of interest for micro-FE results analysis of bone and cement spanned from the bottom-most (most medial) point of the cement to 10 mm above (lateral to) the bottom (most medial) point of peg. This volume included most of the peri-implant region but excluded 2–3 mm near the lateral surface which did show some higher stresses likely associated with minimal cement coverage and fully bonded interface modeled between the bone, cement, and implant. After transforming voxel positions to cylindrical coordinates (r = 0 along peg axis), the outline of the cement mantle was defined using a custom code (Matlab 2013a; Mathworks, Natick, MA) which found maximum-radius cement points according to each angle (θ=0–360° with 1 degree increment). Bone surrounding the cement mantle was identified as any bone within 1.5 mm outside of the cement mantle (Fig. 1b).
For mesh convergence testing quarter models of two specimens, including implant, cement, and bone were utilized (details provided in Supplementary Material). Four voxel element sizes (50, 80, 100, 120 μm) were tested. Displacement was applied to the implant top surface, and bone and cement von Mises stress histograms were compared. The chosen voxel element size of 100 μm produced less than 5 % bone volume differences in histogram bars, compared to the 50 μm element size model (further details provided in Supplementary Material).
Statistical analysis
Correlation and regression analyses were performed between pairs of morphological and mechanical variables using Pearson correlation coefficient (SAS System, Release 9.3, SAS Institute Inc.). The correlation strength was defined with three categories: weak correlations for absolute values of r ≤ 0.35, moderate correlations for 0.36 to 0.67, and strong correlations for 0.68 to 1.0.41 Null hypotheses of r = 0 were tested and p < 0.05 was considered statistically significant. Because of multiple comparisons, p values were adjusted using the Adaptive False Discovery Rate method.42
Results
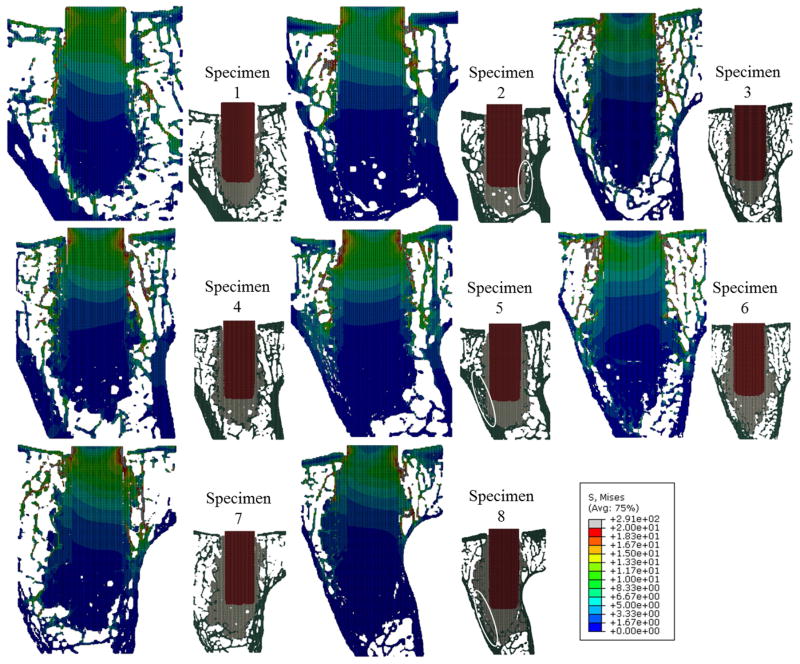
Morphological data of specimens are summarized in Table 1. Specimens 2, 5, and 8 showed the highest amount of contact between cement and cortex (Fig. 4, inset images). There was no contact between the cement and cortex in specimens 1, 3, and 4.
Table 1.
Summary of descriptive statistics.
| Mean | Standard deviation | |
|---|---|---|
| Bone volume fraction* (%) | 18.5 | 1.7 |
| Glenoid width (mm) | 12.4 | 2.5 |
| Implant-cortex distance (mm) | 4.1 | 1.0 |
| Cement volume (mm3) | 400.0 | 162.6 |
| Amount of contact between cement and cortex (grade) | 4.9 | 3.3 |
| Cement-bone interface area (mm2) | 814.1 | 617.7 |
| Cement volume (%) with stress ≥ 7MPa | 5.0 | 2.7 |
| Bone volume (%) with stress ≥ 10 MPa | 18.6 | 5.7 |
Bone volume fraction was obtained from the 10 samples per specimen.
Figure 4.
Von Mises stress distributions at the central transverse plane in each micro-FE model. Locations of the implant (red), cement (gray), and bone (green) can be seen in the smaller inset pictures. Also shown in the inset pictures are locations of contact between the cement and cortex (circled white). Specimen 2, 5 and 8 graded as higher amounts of contact between cement and cortex, and had lower stresses in the trabeculae compared to the other specimens.
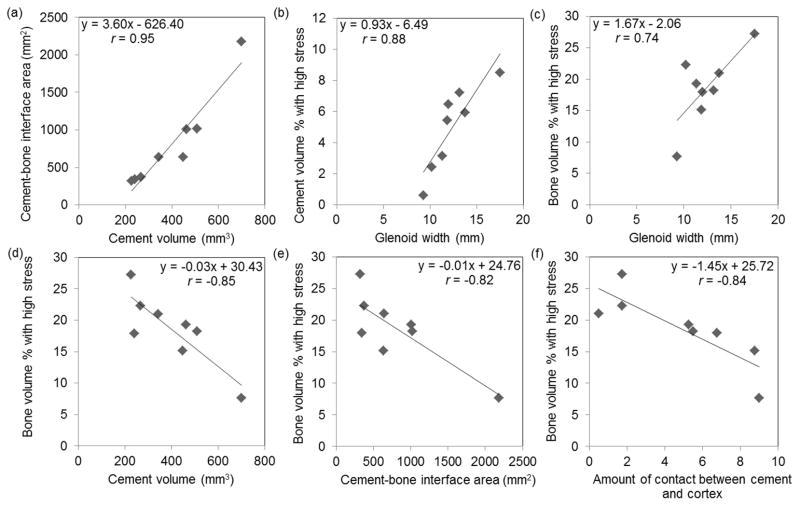
Cement volume was strongly and significantly correlated with cement-bone interface area (r = 0.95, 95% confidence interval (CI) = (0.70, 0.99), p < 0.001, Table 2). Linear regression indicated that an increase of 10 mm3 of cement volume correlated to an average increase of 36 mm2 cement-bone interface area (Fig. 5a). The amount of contact between cement and cortex was significantly correlated with the inverse of implant-cortex distance (r=−0.78, 95% CI = (−0.95, −0.12), p=0.022) and was moderately correlated with cement volume.
Table 2.
Correlation analyses of morphological variables (Pearson Correlation Coefficients (95% Confidence Interval), N = 8).
| Amount of contact between cement and cortex | Cement-bone interface area (mm2) | |
|---|---|---|
| Bone volume fraction (%) | 0.02 (−0.69, 0.71), p=0.384 | −0.20 (−0.79, 0.60), p=0.289 |
| Glenoid width (mm) | −0.53 (−0.89, 0.31), p=0.107 | −0.53 (−0.89, 0.31), p=0.107 |
| Implant-cortex distance (mm) | −0.78 (−0.95, −0.12), p=0.022 | −0.57 (−0.90, 0.26), p=0.099 |
| Cement volume (mm3) | 0.65 (−0.14, 0.92), p=0.069 | 0.95 (0.70, 0.99), p<0.001 |
Figure 5.
Scatter plots and linear regression of key pairs of variables having statistically significant (p < 0.05) correlations. (c)-(f) Less bone volume had high stress in specimens with smaller glenoid width, larger cement volume, larger cement-bone interface area, and larger amount of contact between cement and cortex.
Glenoid width had a strong positive and statistically significant correlation with volume of cement having high stress (r = 0.88, 95% CI = (0.39, 0.97), p = 0.008, Table 3). Linear regression indicated that an increase of 1 mm in glenoid width correlated to an average increase of 0.9 % cement volume with high stress (Fig. 5b).
Table 3.
Correlation analyses between morphological and mechanical variables (Pearson Correlation Coefficients (95% Confidence Interval), N = 8).
| Cement volume (%)with stress ≥ 7 MPa | Bone volume (%)with stress 10 ≥ MPa | |
|---|---|---|
| Bone volume fraction (%) | 0.50 (−0.35, 0.88), p=0.120 | 0.16 (−0.62, 0.77), p=0.304 |
| Glenoid width (mm) | 0.88 (0.39, 0.97), p=0.008 | 0.74 (0.02, 0.94), p=0.034 |
| Implant-cortex distance (mm) | 0.44 (−0.41, 0.87), p=0.147 | 0.79 (0.14, 0.96), p=0.021 |
| Cement volume (mm3) | −0.57 (−0.90, 0.26), p=0.099 | −0.85 (−0.97, 0.30), p=0.014 |
| Amount of contact between cement and cortex | −0.33 (−0.83, 0.51), p=0.211 | −0.84 (−0.97, −0.26), p=0.014 |
| Cement-bone interface area (mm2) | −0.65 (−0.62, −0.92), p=0.069 | −0.82 (−0.96, −0.23), p=0.014 |
Larger glenoid width and implant-cortex distance showed positive correlation with bone having high stress, whereas greater cement volume, amount of contact between cement and cortex, and cement-bone interface area had negative correlation with bone having high stress (Fig. 5c-e, Table 3). Linear regression indicated that increase of 100 mm3 of cement volume correlated to a decrease of 3 % of bone volume with high stress (Fig. 5d). Other linear regression slopes are given in figure 5.
Amount of contact between cement and cortex showed the strong correlation with bone volume with high stress (r = −0.84, 95% CI = (−0.97, −0.26), p = 0.014, Table 3, Fig. 5f). This finding was supported by qualitative observations when inspecting the stress distributions (Fig. 6). Higher stress was observed in the bone surrounding cement mantle in specimens with less cement cortical contact, whereas lower stress was observed in those with more cement cortex contact.
Figure 6.
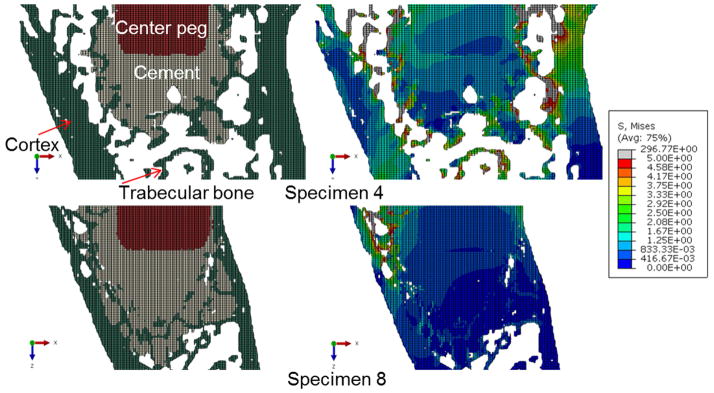
Example of a specimen with minimal contact between cement and cortex (top), and specimen with the most contact (bottom). In the specimen with little contact, it appears the load is more supported by trabecular bone (with higher stresses).
Discussion
Our results demonstrate significant correlations between bone shape, cement morphology, and resulting stress distributions according to FE modeling of eight implanted cadaver glenoids. Results indicate that amount of bone with high stress surrounding the cement is strongly negatively correlated with both greater cement volume used during surgery, and greater contact between the cement and cortex (Table 3). Results also indicate that amount of bone with high stress is strongly positively correlated with both larger glenoid width and larger implant-cortex distance. Taken together, results of the study suggest that contact between the cement and underlying cortex dramatically reduces stresses in bone surrounding the cement (Fig. 6), and this cement-cortex contact likely is dependent on bone shape, cement amount, and implant positioning.
Bone and cement morphological variables may influence potential of bone failure (Table 3). Qualitatively, bone stress distributions show that contact between the cement and cortex may result in more direct support of the cement mantle from the cortex and offloading of the trabecular bone. More recent FE studies of cemented femur components are consistent with our findings in the glenoid.43,44 Janssen et al.44 investigated the effect of type of bone supporting the cement mantle on the fixation of a cemented total hip arthroplasty using a 2D plane-strain FE model. In their study increasing cortical bone support for the cement mantle produced fewer cracks in the cement and less implant rotation than when the cement mantle was supported by trabecular bone. It should be noted this study does not consider potential stress shielding effects or bone necrosis induced by temperature increase associated with cement curing.
The results of our micro-FE analyses were qualitatively compared with experimental observations from separate testing of five cadaver specimens in our laboratory (Fig. 7).45 Briefly, 3-pegged glenoid components were cemented using standard technique into cadaveric glenoids, and compressive cyclic loading was applied based on an ASTM standard approach.46 Specimens were imaged by micro-CT at six time points across 100,000 cycles of cyclic loading, and images were 3D registered. In results of the present study high stresses occurred in the trabecular bone immediately outside of cement mantle; this result is consistent with our experimental observations of locations of trabecular cracking following cyclic loading.
Figure 7.
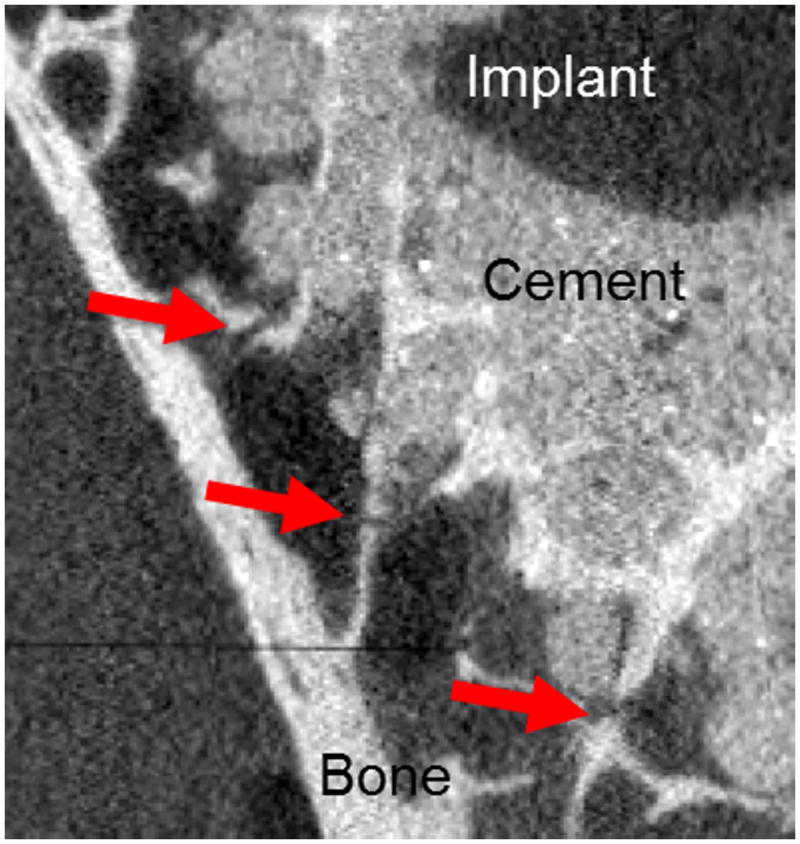
Micro-CT image of cadaveric glenoids implanted with 3-peged implant after 100,000 cycles loading. Cracks (red arrows) were identified in trabeculae immediately surrounding cement mantle.
The finding that highest stresses occurred in trabecular bone at the bone-cement interface is also consistent with previous computational and experimental studies of bovine and synthetic bone.30,31 A notable discrepancy between our results and some previous studies is that we found highest stresses located in trabeculae immediately surrounding the cement mantle, whereas some previous studies of the micromechanics of cemented femoral bone blocks showed highest stresses within the cement itself.28,29,34 This difference may be due to differences between glenoid and femoral trabecular bone architecture, with the glenoid being more porous.
In our cement stress results, only glenoid width showed a strong positive correlation with cement volume having high stress (Table 3, Fig. 5b). This may imply that the wider cross section between cortices could reduce support under the cement mantle, and result in more severe shear loading of the cement. The cement volume showed a moderate negative correlation, although not reaching significance, with the cement volume having high stress. A negative correlation is consistent with previous studies of femoral fixation43,47 in which the cement stress was reduced as the applied cement thickness was increased.
For correlations between cement and bone morphological variables, our results showed that contact between the cement and cortex is correlated with more than one variable, and may be dependent on several factors including glenoid width, implant positioning, and cement volume. Our results showed inverse correlations, although not reaching significance, between cement-cortex contact and both glenoid width and implant-cortex distance, and positive correlation with cement volume. These correlations agree with intuition and may reach significance with testing of additional specimens. If bone has a narrow width as in many glenoid vaults, the morphology of cement is dependent on not only the applied cement volume but also bone shape and implant positioning.
This study has several limitations that are important to note. We applied a single axial load to the peg consistent with pure glenohumeral compression, whereas in 3-pegged glenoids subject to eccentric loading additional loads including bending occur in the central implant peg, and previous studies demonstrated that eccentric loading increased cement stress.24,25 We chose to model only the central peg of a 3-pegged glenoid component because of computational cost considerations. This was based on the simplifying assumption of no biomechanical interaction between the center peg and side pegs. Additionally the reported results assume a fixed outer boundary, which may induce artificial stiffening. This boundary assumption was based on simulations using our macroscopic continuum FE model which showed small (less than 20 μm) displacement at these boundary locations and the sensitivity test which showed small difference between two different sizes of the boundary condition (Supplementary Material). In a previous micro-FE study of screw implants in the resected human humeral head26, the fully constrained model induced a radial direction load transfer while all load was transferred to the bottom plane in the bottom only fixed model. The artificial stiffening due to fixing the outer cortex likely had more pronounced effects in smaller glenoids.
Although mesh convergence testing was performed, stress results of trabeculae modeled with voxel size of 100 μm in this study may differ from that of higher resolution modeling, and other researchers suggested using an element size such that trabeculae are three or four elements wide 35,48 for more accurate results. Computational costs are currently still restrictive in modeling larger structures, and micro-FEA studies of the femur and radius have been reported using voxel sizes ranging from 87.5 to 250 μm to predict bone failure load or bone remodeling.36,49,50 Homogeneous linear elastic material properties were assumed, and viscoelastic effects were not considered. A fully bonded interface between cement and bone was assumed, which may decrease interface deformation and increase the stiffness of interface.27 Glenoid width and implant-cortex distance were measured at a single cross-section at the bottom of the implant. The use of simplified risk of failure criteria (related to the amount of bone or cement that is highly stressed) is a common approach in the analyses of bone samples, but has not been validated in the evaluation of implants in bone, and there is uncertainty in failure stress thresholds. The study only considered time-zero biomechanics and did not consider any changes in vivo such as bone adaptation or resorption.
In our study, micro-FE analyses of implanted cadaver glenoids demonstrated significant correlations between bone shape, cement morphology, and resulting stress. Results indicate larger cement volumes and contact between cement and cortex are both strongly negatively correlated with high trabecular bone stresses surrounding the cement, and may provide a stronger support of cement mantle.
Supplementary Material
Acknowledgments
5KL2TR000126-03 funded by the NIH and Penn State’s Clinical and Translational Science Institute. We gratefully acknowledge the contributions of the anonymous reviewers during the peer review process.
Footnotes
Author Contributions: research design (G.L., H.W.), data acquisition (H.W., W.F.), data analysis (H.W., G.L.), statistical analysis (A.K., H.W., G.L.), data interpretation (G.L., H.W., A.A.), manuscript preparation (H.W., G.L.), manuscript edits (H.W., A.K., A.A., G.L). All authors have read and approved the final submitted manuscript.
Disclosure: G.S.L. has received implants and CAD files for a different project (fracture repair implants) from Synthes. A.D.A. is a consultant for Zimmer for new glenoid design, and received glenoid implants from Zimmer for research in the past.
References
- 1.Amstutz HC, Ma SM, Jinnah RH, Mai L. Revision of aseptic loose total hip arthroplasties. Clin Orthop. 1982;170:21–33. [PubMed] [Google Scholar]
- 2.Clohisy JC, Calvert G, Tull F, et al. Reasons for Revision Hip Surgery: A Retrospective Review. Clin Orthop Relat Res Dec. 2004;2004 :188–192. doi: 10.1097/01.blo.0000150126.73024.42. [DOI] [PubMed] [Google Scholar]
- 3.Ulrich SD, Seyler TM, Bennett D, et al. Total hip arthroplasties: What are the reasons for revision? Int Orthop. 2008;32(5):597–604. doi: 10.1007/s00264-007-0364-3. [DOI] [PMC free article] [PubMed] [Google Scholar]
- 4.Insall JN, Dethmers DA. Revision of total knee arthroplasty. Clin Orthop. 1982;170:123–130. [PubMed] [Google Scholar]
- 5.Sharkey PF, Hozack WJ, Rothman RH, et al. Why are total knee arthroplasties failing today? Clin Orthop. 2002;404:7–13. doi: 10.1097/00003086-200211000-00003. [DOI] [PubMed] [Google Scholar]
- 6.Torchia ME, Cofield RH, Settergren CR. Total shoulder arthroplasty with the neer prosthesis: Long-term results. J Shoulder Elbow Surg. 1997;6(6):495–505. doi: 10.1016/s1058-2746(97)90081-1. [DOI] [PubMed] [Google Scholar]
- 7.Boileau P, Avidor C, Krishnan SG, et al. Cemented polyethylene versus uncemented metal-backed glenoid components in total shoulder arthroplasty: A prospective, double-blind, randomized study. J Shoulder Elbow Surg. 2002;11(4):351–359. doi: 10.1067/mse.2002.125807. [DOI] [PubMed] [Google Scholar]
- 8.Bohsali KI, Wirth MA, Rockwood CA., Jr Complications of Total Shoulder Arthroplasty. J Bone Jt Surg. 2006;88(10):2279–2292. doi: 10.2106/JBJS.F.00125. [DOI] [PubMed] [Google Scholar]
- 9.Bauer TW, Schils J. The pathology of total joint arthroplasty. Skeletal Radiol. 1999;28(9):483–497. doi: 10.1007/s002560050552. [DOI] [PubMed] [Google Scholar]
- 10.Ingham E, Fisher J. Biological reactions to wear debris in total joint replacement. Proc Inst Mech Eng [H] 2000;214(1):21–37. doi: 10.1243/0954411001535219. [DOI] [PubMed] [Google Scholar]
- 11.Wirth MA, Rockwood J, Charles A. Current Concepts Review - Complications of Total Shoulder-Replacement Arthroplasty*. J Bone Jt Surg. 1996;78(4):603–16. doi: 10.2106/00004623-199604000-00018. [DOI] [PubMed] [Google Scholar]
- 12.Yian EH, Werner CML, Nyffeler RW, et al. Radiographic and Computed Tomography Analysis of Cemented Pegged Polyethylene Glenoid Components in Total Shoulder Replacement. J Bone Jt Surg. 2005;87(9):1928–1936. doi: 10.2106/JBJS.D.02675. [DOI] [PubMed] [Google Scholar]
- 13.Neer CS, Watson KC, Stanton FJ. Recent experience in total shoulder replacement. J Bone Joint Surg Am. 1982;64(3):319–337. [PubMed] [Google Scholar]
- 14.Norris BL, Lachiewicz PF. Modern cement technique and the survivorship of total shoulder arthroplasty. Clin Orthop. 1996;(328):76–85. doi: 10.1097/00003086-199607000-00014. [DOI] [PubMed] [Google Scholar]
- 15.Nyffeler RW, Anglin C, Sheikh R, Gerber C. Influence of peg design and cement mantle thickness on pull-out strength of glenoid component pegs. J Bone Joint Surg Br. 2003;85-B(5):748–752. [PubMed] [Google Scholar]
- 16.Klepps S, Chiang AS, Miller S, et al. Incidence of early radiolucent glenoid lines in patients having total shoulder replacements. Clin Orthop. 2005;(435):118–125. doi: 10.1097/01.blo.0000155080.37228.65. [DOI] [PubMed] [Google Scholar]
- 17.Kasten P, Pape G, Raiss P, et al. Mid-term survivorship analysis of a shoulder replacement with a keeled glenoid and a modern cementing technique. J Bone Joint Surg Br. 2010;92-B(3):387–392. doi: 10.1302/0301-620X.92B3.23073. [DOI] [PubMed] [Google Scholar]
- 18.Blacker GJ, Charnley J. Changes in the upper femur after low friction arthroplasty. Clin Orthop. 1978;137:15–23. [PubMed] [Google Scholar]
- 19.Hopkins AR, Hansen UN, Amis AA, et al. Finite element modelling of glenohumeral kinematics following total shoulder arthroplasty. J Biomech. 2006;39(13):2476–2483. doi: 10.1016/j.jbiomech.2005.07.031. [DOI] [PubMed] [Google Scholar]
- 20.Mann KA, Damron LA, Miller MA, et al. Stem–cement porosity may explain early loosening of cemented femoral hip components: Experimental–computational in vitro study. J Orthop Res. 2007;25(3):340–350. doi: 10.1002/jor.20330. [DOI] [PMC free article] [PubMed] [Google Scholar]
- 21.Lennon AB, Britton JR, MacNiocaill RF, et al. Predicting revision risk for aseptic loosening of femoral components in total hip arthroplasty in individual patients—A finite element study. J Orthop Res. 2007;25(6):779–788. doi: 10.1002/jor.20346. [DOI] [PubMed] [Google Scholar]
- 22.Coultrup OJ, Hunt C, Wroblewski BM, Taylor M. Computational assessment of the effect of polyethylene wear rate, mantle thickness, and porosity on the mechanical failure of the acetabular cement mantle. J Orthop Res. 2010;28(5):565–570. doi: 10.1002/jor.21040. [DOI] [PubMed] [Google Scholar]
- 23.Sharma GB, Debski RE, McMahon PJ, Robertson DD. Effect of glenoid prosthesis design on glenoid bone remodeling: Adaptive finite element based simulation. J Biomech. 2010;43(9):1653–1659. doi: 10.1016/j.jbiomech.2010.03.004. [DOI] [PubMed] [Google Scholar]
- 24.Couteau B, Mansat P, Estivalèzes É, et al. Finite element analysis of the mechanical behavior of a scapula implanted with a glenoid prosthesis. Clin Biomech. 2001;16(7):566–575. doi: 10.1016/s0268-0033(01)00029-8. [DOI] [PubMed] [Google Scholar]
- 25.Terrier A, Büchler P, Farron A. Bone–cement interface of the glenoid component: Stress analysis for varying cement thickness. Clin Biomech. 2005;20(7):710–717. doi: 10.1016/j.clinbiomech.2005.03.010. [DOI] [PubMed] [Google Scholar]
- 26.Wirth AJ, Müller R, Harry van Lenthe G. The discrete nature of trabecular bone microarchitecture affects implant stability. J Biomech. 2012;45(6):1060–1067. doi: 10.1016/j.jbiomech.2011.12.024. [DOI] [PubMed] [Google Scholar]
- 27.Janssen D, Mann KA, Verdonschot N. Micro-mechanical modeling of the cement–bone interface: The effect of friction, morphology and material properties on the micromechanical response. J Biomech. 2008;41(15):3158–3163. doi: 10.1016/j.jbiomech.2008.08.020. [DOI] [PMC free article] [PubMed] [Google Scholar]
- 28.Janssen D, Mann KA, Verdonschot N. Finite element simulation of cement-bone interface micromechanics: A comparison to experimental results. J Orthop Res. 2009;27(10):1312–1318. doi: 10.1002/jor.20882. [DOI] [PMC free article] [PubMed] [Google Scholar]
- 29.Waanders D, Janssen D, Mann KA, Verdonschot N. The mechanical effects of different levels of cement penetration at the cement–bone interface. J Biomech. 2010;43(6):1167–1175. doi: 10.1016/j.jbiomech.2009.11.033. [DOI] [PMC free article] [PubMed] [Google Scholar]
- 30.Tozzi G, Zhang Q-H, Tong J. 3D real-time micromechanical compressive behaviour of bone–cement interface: Experimental and finite element studies. J Biomech. 2012;45(2):356–363. doi: 10.1016/j.jbiomech.2011.10.011. [DOI] [PubMed] [Google Scholar]
- 31.Zhao Y, Brown KAR, Jin ZM, Wilcox RK. Trabecular Level Analysis of Bone Cement Augmentation: A Comparative Experimental and Finite Element Study. Ann Biomed Eng. 2012;40(10):2168–2176. doi: 10.1007/s10439-012-0587-3. [DOI] [PMC free article] [PubMed] [Google Scholar]
- 32.Lewis GS, Armstrong AD. Glenoid spherical orientation and version. J Shoulder Elbow Surg. 2011;20(1):3–11. doi: 10.1016/j.jse.2010.05.012. [DOI] [PubMed] [Google Scholar]
- 33.Doube M, Kosowski MM, Arganda-Carreras I, et al. BoneJ: Free and extensible bone image analysis in ImageJ. Bone. 2010;47(6):1076–1079. doi: 10.1016/j.bone.2010.08.023. [DOI] [PMC free article] [PubMed] [Google Scholar]
- 34.Mann KA, Miller MA, Cleary RJ, et al. Experimental micromechanics of the cement–bone interface. J Orthop Res. 2008;26(6):872–879. doi: 10.1002/jor.20575. [DOI] [PMC free article] [PubMed] [Google Scholar]
- 35.Niebur GL, Hsia AC, Keaveny TM, Yuen JC. Convergence Behavior of High- Resolution Finite Element Models of Trabecular Bone. J Biomech Eng. 1999;121(6):629–635. doi: 10.1115/1.2800865. [DOI] [PubMed] [Google Scholar]
- 36.Pistoia W, van Rietbergen B, Lochmüller E-M, et al. Estimation of distal radius failure load with micro-finite element analysis models based on three-dimensional peripheral quantitative computed tomography images. Bone. 2002;30(6):842–848. doi: 10.1016/s8756-3282(02)00736-6. [DOI] [PubMed] [Google Scholar]
- 37.Lacroix D, Murphy LA, Prendergast PJ. Three-Dimensional Finite Element Analysis of Glenoid Replacement Prostheses: A Comparison of Keeled and Pegged Anchorage Systems. J Biomech Eng. 2000;122(4):430. doi: 10.1115/1.1286318. [DOI] [PubMed] [Google Scholar]
- 38.Niebur GL, Feldstein MJ, Yuen JC, et al. High-resolution finite element models with tissue strength asymmetry accurately predict failure of trabecular bone. J Biomech. 2000;33(12):1575–1583. doi: 10.1016/s0021-9290(00)00149-4. [DOI] [PubMed] [Google Scholar]
- 39.Bayraktar HH, Morgan EF, Niebur GL, et al. Comparison of the elastic and yield properties of human femoral trabecular and cortical bone tissue. J Biomech. 2004;37(1):27–35. doi: 10.1016/s0021-9290(03)00257-4. [DOI] [PubMed] [Google Scholar]
- 40.Westerhoff P, Graichen F, Bender A, et al. In vivo measurement of shoulder joint loads during activities of daily living. J Biomech. 2009;42(12):1840–1849. doi: 10.1016/j.jbiomech.2009.05.035. [DOI] [PubMed] [Google Scholar]
- 41.Taylor R. Interpretation of the Correlation Coefficient: A Basic Review. J Diagn Med Sonogr. 1990;6(1):35–39. [Google Scholar]
- 42.Benjamini Y, Hochberg Y. On the Adaptive Control of the False Discovery Rate in Multiple Testing With Independent Statistics. J Educ Behav Stat. 2000;25(1):60–83. [Google Scholar]
- 43.Ayers D, Mann K. The importance of proximal cement filling of the calcar region: a biomechanical justification. J Arthroplasty. 2003;18(Supplement):103–109. doi: 10.1016/s0883-5403(03)00342-5. [DOI] [PubMed] [Google Scholar]
- 44.Janssen D, van Aken J, Scheerlinck T, Verdonschot N. Finite element analysis of the effect of cementing concepts on implant stability and cement fatigue failure. Acta Orthop. 2009;80(3):319–324. doi: 10.3109/17453670902947465. [DOI] [PMC free article] [PubMed] [Google Scholar]
- 45.Lewis GS, Brenza J, Paul E, Armstrong AD. Construct damage and loosening in glenoid implants: a longitudinal micro-CT study in five cadavers. 2012 doi: 10.1002/jor.23119. (manuscript submitted) [DOI] [PMC free article] [PubMed] [Google Scholar]
- 46.American Society for Testing and Materials (ASTM) F2028-08. Standard Test Methods for Dynamic Evaluation of Glenoid Loosening or Disassociation.
- 47.Ramaniraka NA, Rakotomanana LR, Leyvraz P-F. The fixation of the cemented femoral component EFFECTS OF STEM STIFFNESS, CEMENT THICKNESS AND ROUGHNESS OF THE CEMENT-BONE SURFACE. J Bone Joint Surg Br. 2000;82-B(2):297–303. [PubMed] [Google Scholar]
- 48.Guldberg RE, Hollister SJ, Charras GT. The Accuracy of Digital Image-Based Finite Element Models. J Biomech Eng. 1998;120(2):289–295. doi: 10.1115/1.2798314. [DOI] [PubMed] [Google Scholar]
- 49.Tsubota K, Suzuki Y, Yamada T, et al. Computer simulation of trabecular remodeling in human proximal femur using large-scale voxel FE models: Approach to understanding Wolff’s law. J Biomech. 2009;42(8):1088–1094. doi: 10.1016/j.jbiomech.2009.02.030. [DOI] [PubMed] [Google Scholar]
- 50.Boyle C, Kim IY. Comparison of different hip prosthesis shapes considering microlevel bone remodeling and stress-shielding criteria using three-dimensional design space topology optimization. J Biomech. 2011;44(9):1722–1728. doi: 10.1016/j.jbiomech.2011.03.038. [DOI] [PubMed] [Google Scholar]
Associated Data
This section collects any data citations, data availability statements, or supplementary materials included in this article.


