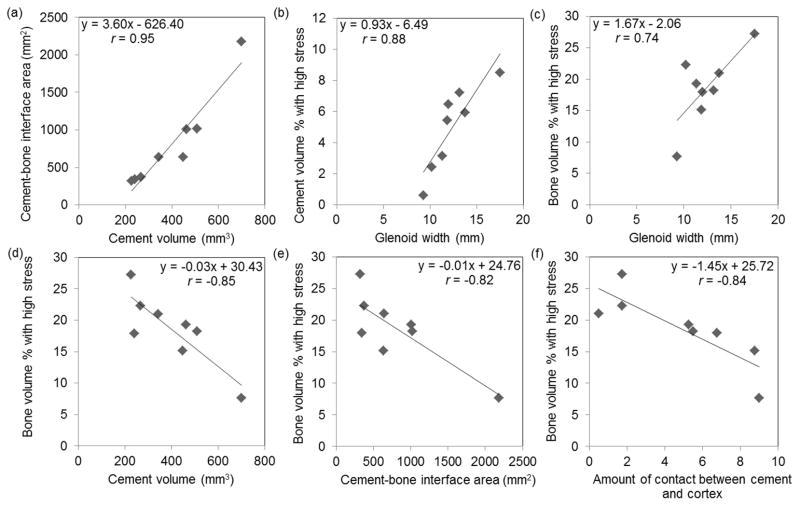
Figure 5.
Scatter plots and linear regression of key pairs of variables having statistically significant (p < 0.05) correlations. (c)-(f) Less bone volume had high stress in specimens with smaller glenoid width, larger cement volume, larger cement-bone interface area, and larger amount of contact between cement and cortex.

