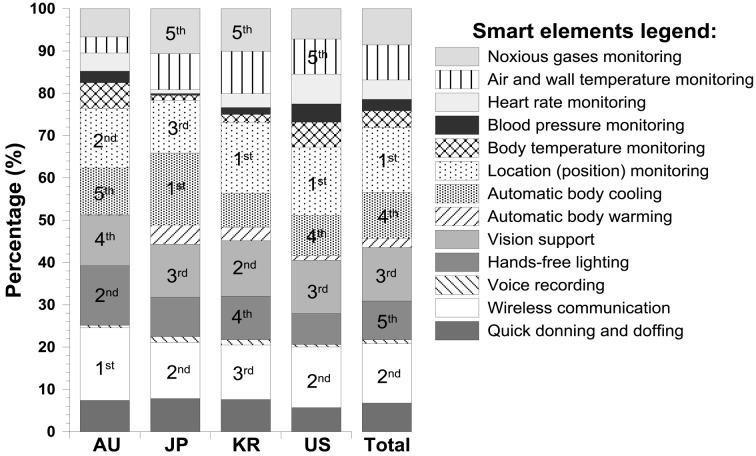
Fig. 3.
National voting patterns for the top five elements of smart, personal protective equipment shown in Fig. 1, as reported by Australian (AU), Japanese (JP), Korean (KR) and United States (US) firefighters. The far right bar is the distribution for the entire sample (Total). Data are response percentages. Missing ranks signify two or more elements obtained equal votes.

