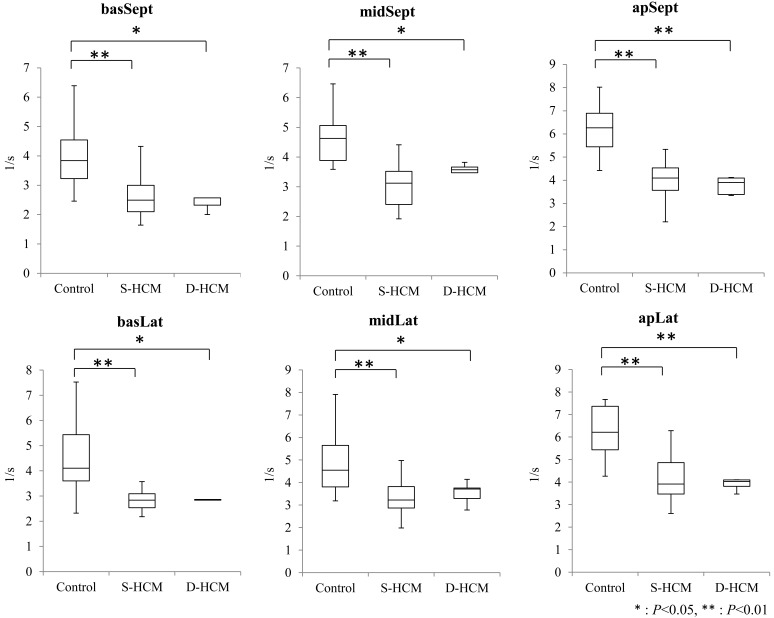
Fig. 3.
Segmental SrLe values in normal and HCM groups. The boxes represent the interquartile ranges. Horizontal bar represents the median value for each group. SrLe significantly decreased in all segments in S-HCM and D-HCM groups, compared with the control group. basSept: Baseseptum; midSept: Middleseptum; apSept: Apicalseptum; apLat: Apicallateral; midLat: Middlelateral; basalt: Baselateral. **P<0.01.

