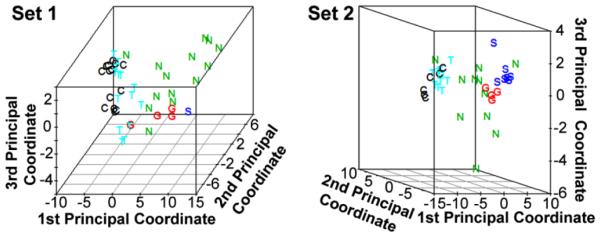
Figure 1. PCA reveals clustering of expression profiles of samples within each experimental group except NSOI.

In both data sets, the NSOI samples were much more heterogeneous and not clustered. The distance between points on the plots is indicative of the difference between gene expression profiles. Rotatable views of the 3-dimensional plots are in online supplemental files (Set1_PCA and Set2_PCA). C: Control; G: GPA; N: NSOI; S: Sarcoidosis; T: TED.
