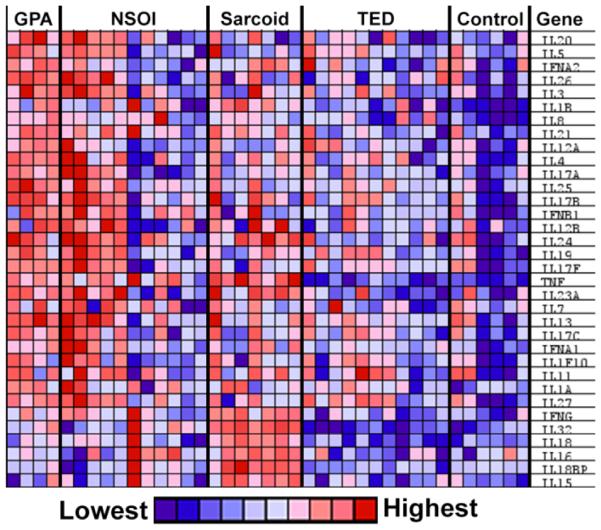
Figure 2. Orbital adipose tissues from some NSOI patients have cytokine expression profile similar to GPA patients.

The GPA profile differs from the sarcoidosis, TED, and control profiles. A heat map of relative transcript levels was generated by GSEA from data set 2.
