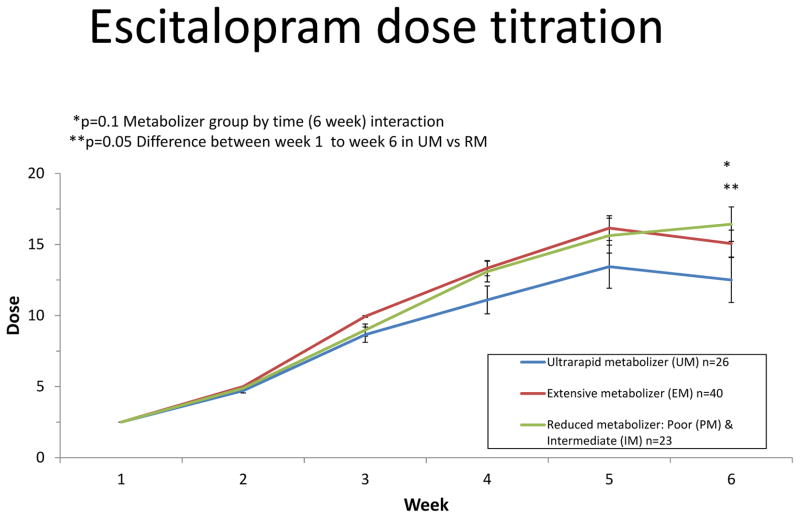
Figure 2. Escitalopram dose titration.
Participants were initiated on a dose of 2.5 mg escitalopram at the beginning of week 1 of the study followed by weekly increases to 5, 10, 15, and finally 20 mg po qd. If participants experienced adverse effects, the titration escalation was altered to maintain a tolerated dose. Results shown are stratified by CYP2C19 metabolizer groups. Significance values represent differences in the linear rate of dosing change from week 1 to time of follow-up assessments. Follow-up analyses indicated differences in the slope of dosing change starting from week 4 and continuing through week 6 in the ultrarapid metabolizers compared to extensive metabolizers (week 4 vs week 1 p=0.04; week 5 vs week 1 p=0.016; week 6 vs week 1 p=0.02). The difference in the slope of dosing change was evident at week 6 when comparing the ultrarapid metabolizers to reduced metabolizers (p=0.0025).

