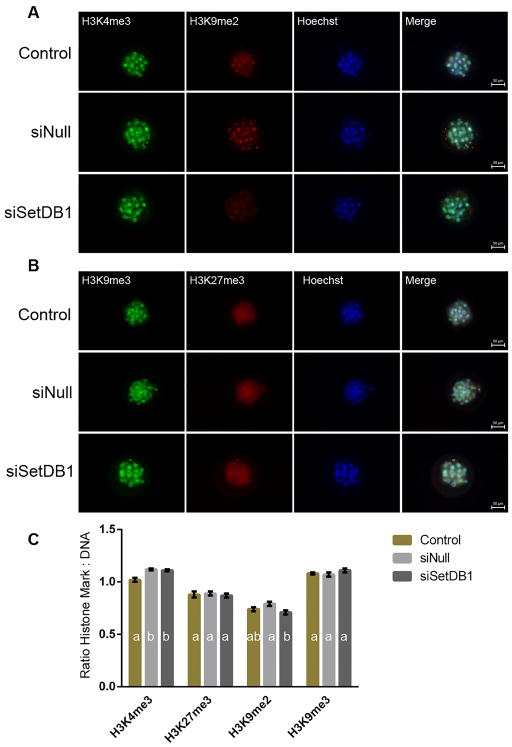
Fig 2.
Analysis of post-translational histone modifications in siSETDB1 injected embryos. Representative confocal images of viable morula-stage embryos co-stained with (A) H3K4me3 (green)/H3K9me2 (red)/Hoechst (blue), as well as (B) H3K9me3 (green)/H3K27 (red)/Hoechst (blue). Images are at 20 × magnification. C) Average fluorescence intensity ratios were calculated for each embryo by dividing the intensity of the specific target (H3K4me3, H3K9me2, H3K9me3 and H3K27me3) by the intensity of DNA stain (Hoechst). Ratios for each post-translational modification from each embryo were then averaged to obtain a mean ratio for each treatment group and staining combination. Using these means, a one-way ANOVA model was constructed in order to determine differences between treatment groups for each staining. Bars displaying different letters were considered to be significantly different (p < 0.05). Error bars represent the SEM.

