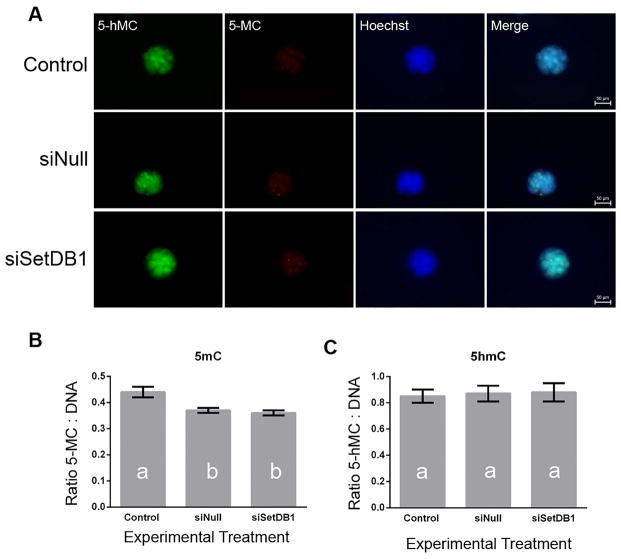
Fig 3.
Analysis of global levels of 5-methyl-cytosine and 5-hydroxy-methyl-cytosine in siSETDB1 injected embryos. A) Representative confocal images of morula-stage embryos co-stained with antibodies recognizing 5-hydroxy-methyl-cytosine (green)/5-methyl-cytosine (red)/the DNA stain Hoechst (blue). Images are at 20 × magnification. B) Average fluorescence intensity ratios were calculated for each embryo by dividing the intensity of the specific target (5-hMC or 5-MC) by the intensity of DNA stain (Hoechst). Ratios from each embryo were then averaged to obtain a mean ratio for each treatment group. Using these means, a one-way ANOVA model was developed in order to examine differences between treatment groups. Bars displaying different letters were considered to be different (p < 0.05). Error bars represent the SEM.

