
Figure 1.
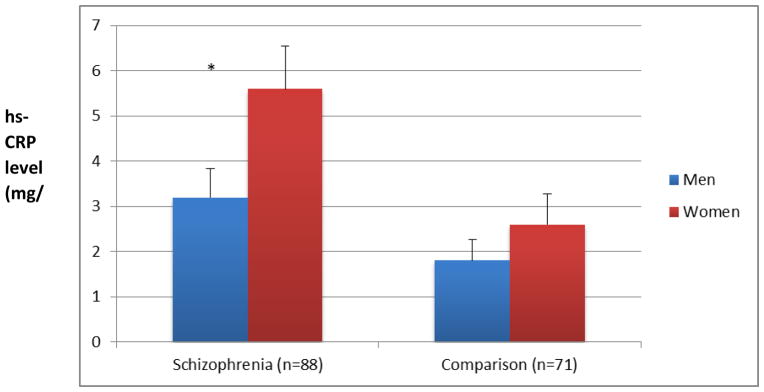
Gender by Diagnosis Associations of hs-CRP Levels (Means and Standard Bars)
Note: * Men versus women in the group with schizophrenia (t(87)=2.56, p=0.010); Men versus women in the comparison group (t(70)=0.6, p=0.500.
Official websites use .gov
A
.gov website belongs to an official
government organization in the United States.
Secure .gov websites use HTTPS
A lock (
) or https:// means you've safely
connected to the .gov website. Share sensitive
information only on official, secure websites.
Gender by Diagnosis Associations of hs-CRP Levels (Means and Standard Bars)
Note: * Men versus women in the group with schizophrenia (t(87)=2.56, p=0.010); Men versus women in the comparison group (t(70)=0.6, p=0.500.