
Fig. 3.
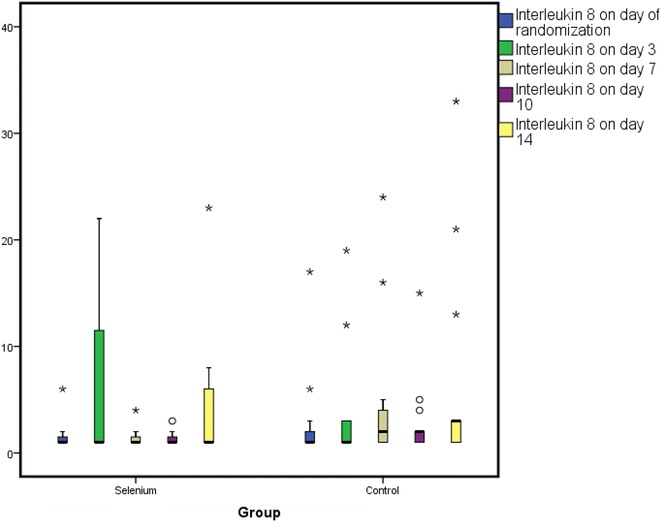
A box plot showing changes in IL-8 over time period of study patients. Figure shows mean ± SD
Official websites use .gov
A
.gov website belongs to an official
government organization in the United States.
Secure .gov websites use HTTPS
A lock (
) or https:// means you've safely
connected to the .gov website. Share sensitive
information only on official, secure websites.
A box plot showing changes in IL-8 over time period of study patients. Figure shows mean ± SD