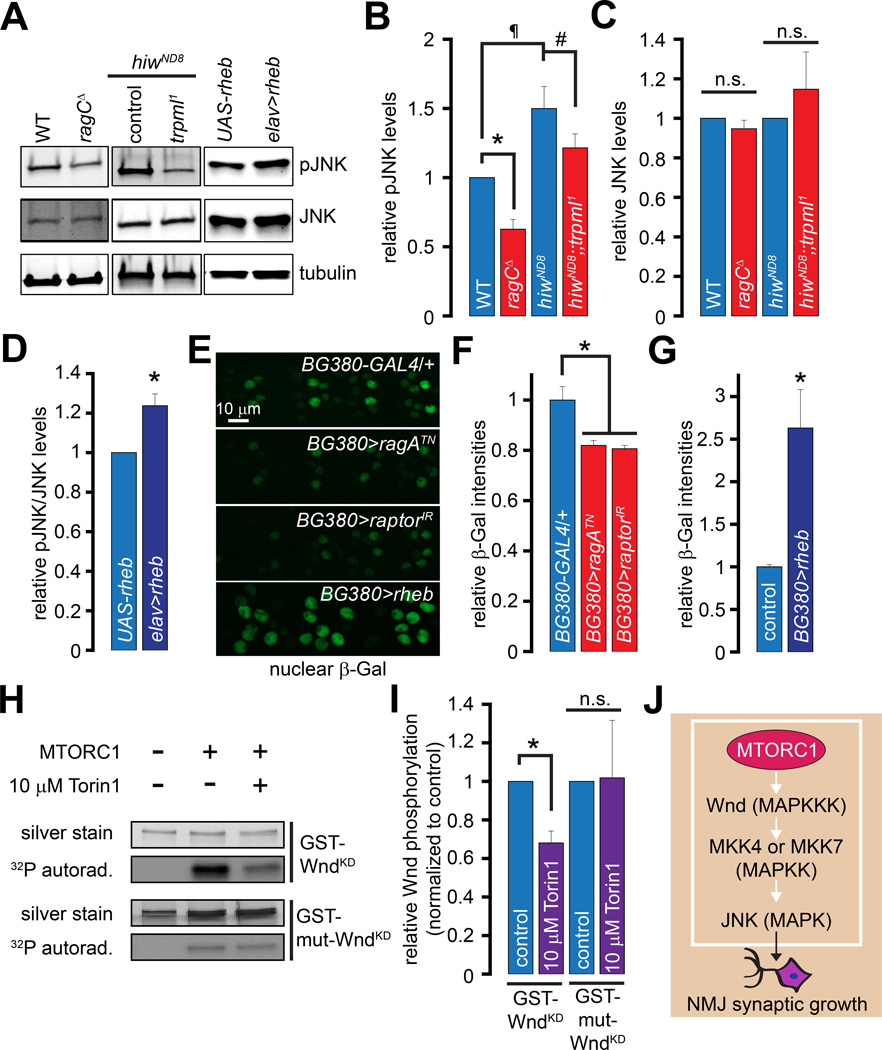
Figure 5. Lysosomal function and Rag/MTORC1 promote Wnd/JNK phosphorylation and puckered expression.
(A) Western blots performed with larval brain extracts of the indicated genotypes probed with α-pJNK, α-JNK, and α-tubulin primary antibodies.
(B) Bar graph showing the pJNK band intensities normalized to the tubulin band intensities in the indicated genotypes.
(C) Bar graph showing the JNK band intensities normalized to the tubulin band intensities in the indicated genotypes.
Values shown in (B–C) are relative to the WT controls.
(D) Bar graph showing the pJNK/JNK band intensities in the indicated genotypes. The values shown are normalized to the UAS-rheb controls.
(E) Representative images showing nuclear β-Gal staining in MN cell bodies in animals of the indicated genotypes. All animals shown in (E) carried the puc-LacZ transgene and UAS-Dicer2. UAS-Dicer2 alone did not affect puc-LacZ expression (data not shown). The scale bar shown in the top panel applies to all panels. The BG380>rheb nuclei are larger consistent with the well-known effects of Rheb to increase cells size in Drosophila (Stocker et al., 2003), and the data shown are the average β-Gal intensities over the entire nucleus to control for changes in nuclear size.
(F–G) Bar graph showing relative nuclear β-Gal intensities in the indicated genotypes. The control in (G) is BG380-GAL4/+.
(H) In vitro kinase assay using purified MTORC1 on recombinant GST-WndKD and GST-mut-WndKD. Upper panels, silver stain showing total GST-WndKD or GST-mut-WndKD levels in each sample; Lower panels, 32P autoradiograms showing extent of GST-WndKD or GST-mut-WndKD phosphorylation in the presence of purified MTORC1 with or without 10 mM Torin1 as indicated.
(I) Bar graph showing quantification of GST-WndKD and GST-mut-WndKD phosphorylation in the absence (control) or presence of 10 µM Torin1 as indicated. Data shown are normalized to controls.
(J) MTORC1 phosphorylates Wnd resulting in JNK activation and NMJ synaptic growth. MKK4 and MKK7 are MAPKK upstream of JNK (Geuking et al., 2009).
“*”, “#”, and “¶” represent statistical significance. Abbreviations: n.s., not significant.

