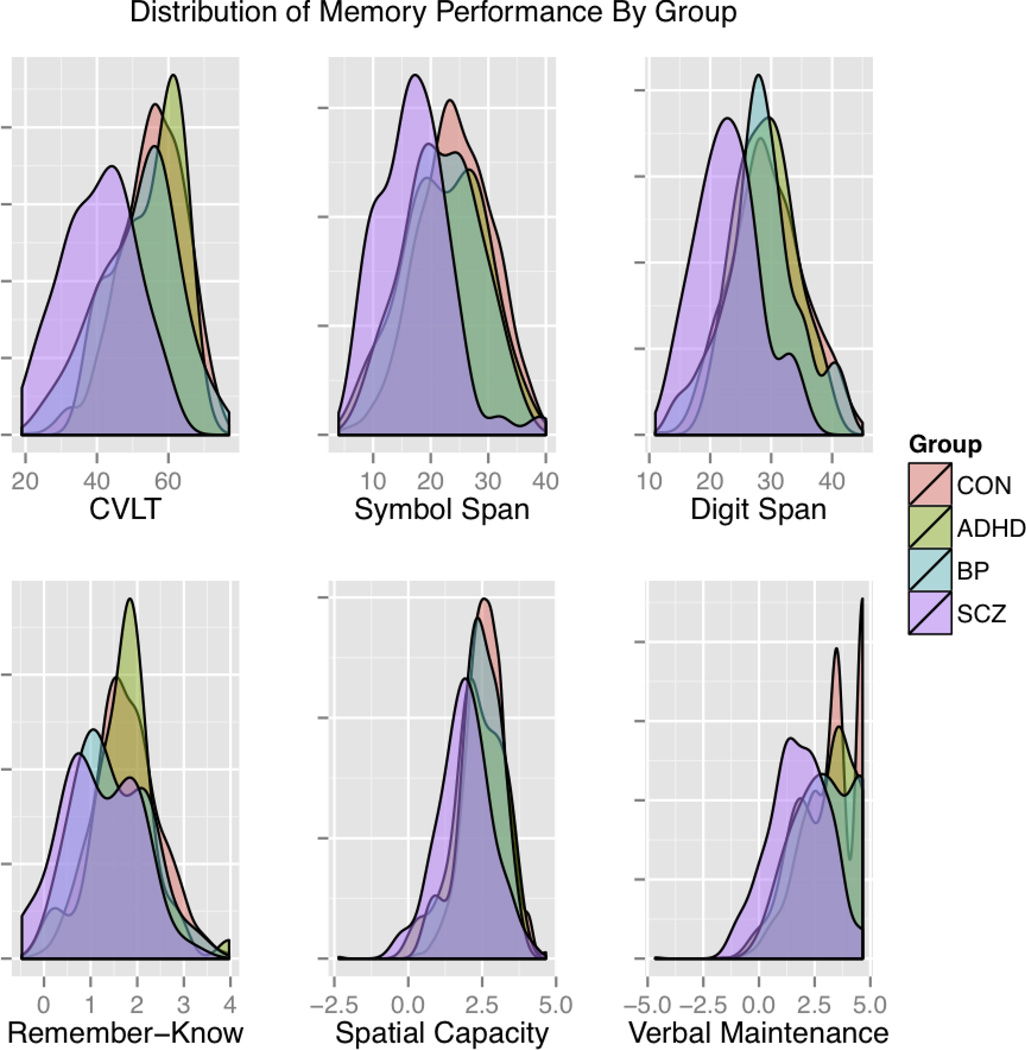
Figure 1.
Density plots of the distribution of memory performance for each group on a representative subset of the measures. Distributions are represented as the proportion of each sample falling in a given range using a Gaussian kernel density curve to facilitate comparisons across groups despite sample size differences. Three neuropsychological and three cognitive/experimental measures are shown covering verbal episodic memory and spatial and verbal working memory. The primary measures for comparison were the total raw score for the CVLT, Symbol Span and Digit Span and d-prime for the Remember-Know, Spatial Capacity (SCAP), and Verbal Maintenance (VMNM – Maintenance) measures. Performance on each task was scaled (M=0, SD=1) across all participants.

