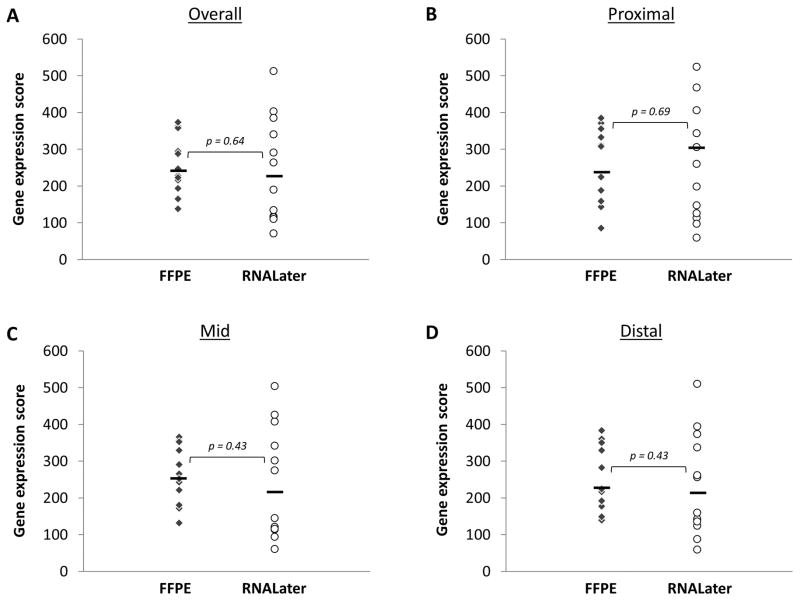
Figure 1.
Comparison of gene expression scores for samples persevered in FFPE (diamonds) vs RNALater (circles). (A) Overall score. (B) Score for the proximal esophageal biopsy. (C) Score for the mid esophageal biopsy. (D) Score for the distal esophageal biopsy. For all graphs, the solid black line represents the median value.

