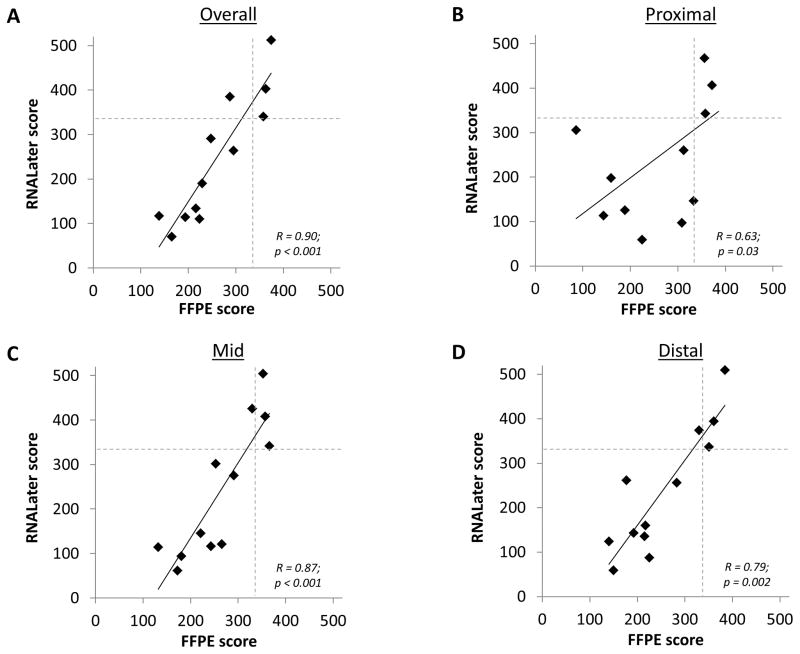
Figure 2.
Correlation of gene expression scores measured in FFPE and RNALater. (A) Overall score. (B) Score for the proximal esophageal biopsy. (C) Score for the mid esophageal biopsy. (D) Score for the distal esophageal biopsy. For all graphs, the dotted lines show the score cut point (333) below which a score is consistent with a diagnosis of EoE.

