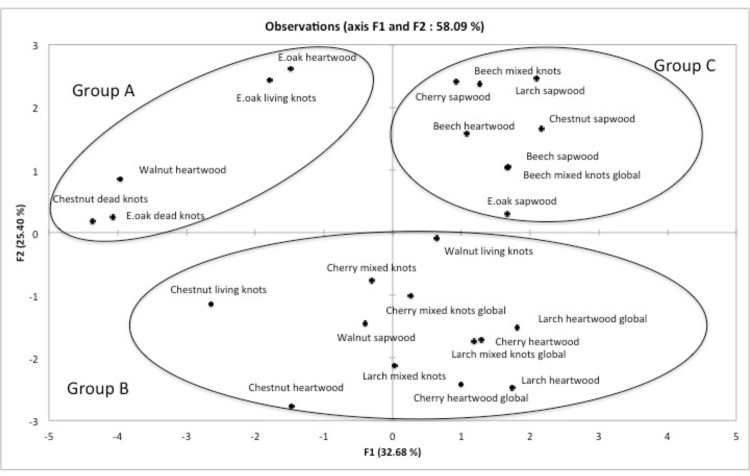
Fig 3. Principal component analysis plot showing the distribution of acetonic extractives from tested hardwood.
A matrix based on the interactions between the six studied TvGSTO and these extractives determined using the fluorescence-based thermal stability assay and the competition experiments was used as input

