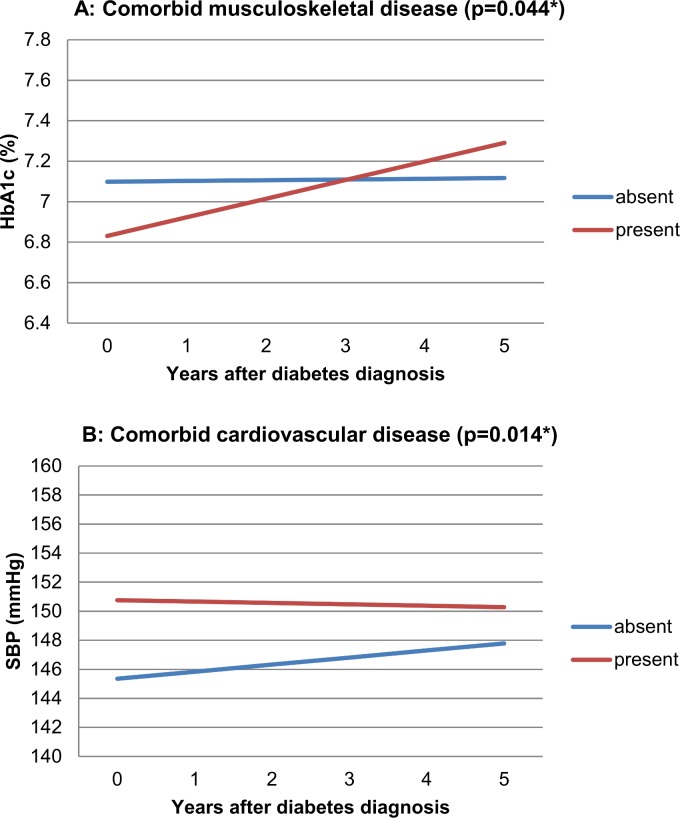
Fig 3. Effect of comorbid musculoskeletal disease on five year HbA1C trend (Panel A, p 0.044*) and of comorbid cardiovascular disease on five year SBP trend (Panel B, p 0.014*).
The reference category is male sex, low SES, median age, median BMI, and ‘absence of other comorbidity’. Beta-coefficients (slopes for graph lines): Panel A (% HbA1C per year): Musculoskeletal disease absent: +0,0037; musculoskeletal disease present: +0,0921. Panel B (mmHg per year): Cardiovascular disease absent: +0,486; cardiovascular disease present: -0,096.

