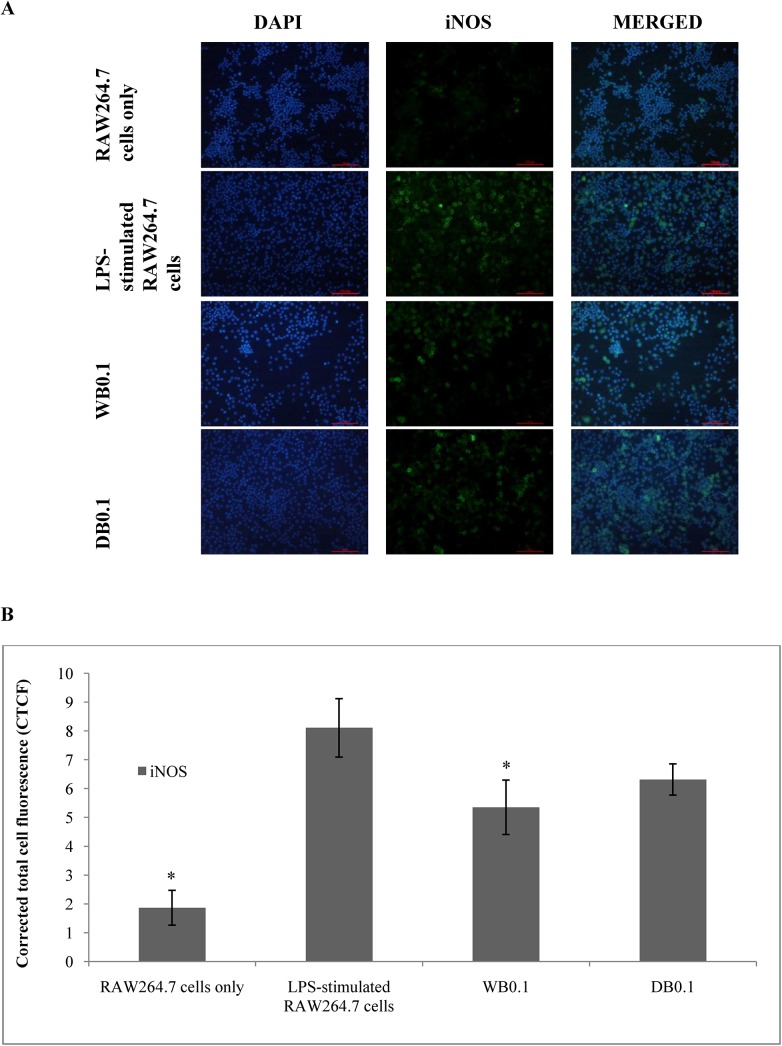
Fig 5. (A) Effects of HF, WB, and DB on iNOS activity in LPS-stimulated RAW264.7 cells. iNOS was localised by fluorescence microscopy after immunofluorescence staining with iNOS antibody (green). Cells were stained with DAPI for visualization of nuclei (blue); (B) Quantification of fluorescence intensity (S1 Dataset).
The fluorescence intensity was quantified using ImageJ and displayed in corrected total cell fluorescence (CTCF) Results shown represent the mean ± SD, n = 3 and *p < 0.05 versus LPS-induced iNOS expression alone.

