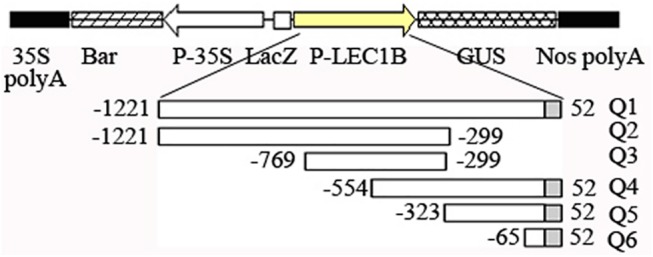
Fig 5. The constructs of GUS expression driven by AhLEC1B promoter and schematic representation of the different length promoters with 5′ or 3′ terminal deletion.

Q1-Q6 indicates the different promoters with 5′ or 3′ terminal deletion. The white and gray rectangles show the upstream promoter region from TSS and 5′ UTR region respectively.
