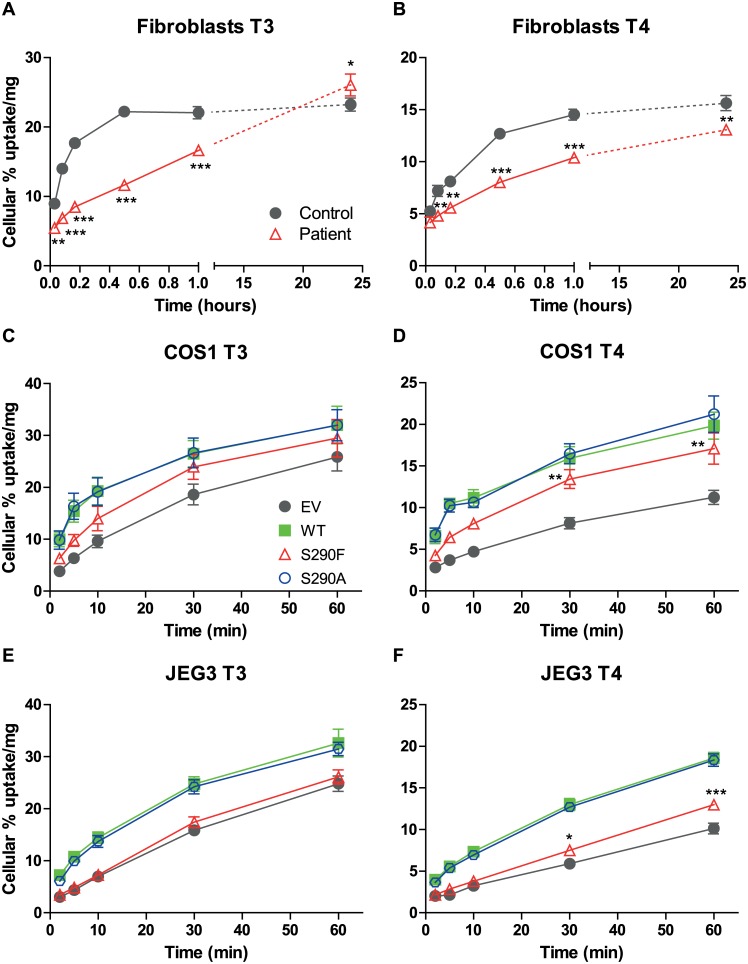
Fig 4. Cellular uptake of [125I]T3 and [125I]T4 by WT and mutated MCT8.
Time dependent cellular uptake of [125I]T3 (A,C,E) and [125I]T4 (B,D,F) in fibroblasts (A,B), and in transiently transfected COS1 cells (C,D) and JEG3 cells (E,F). Uptake is shown as percentage of added T3 or T4 and corrected for protein. Results are presented as mean ± SEM (n = 3). Significance is indicated for control vs. patient fibroblasts (A,B). C-F Mutual difference of WT MCT8 and mutants was tested; if significant, difference with control (EV) was tested. *P <0.05; **P <0.01; ***P <0.001.

