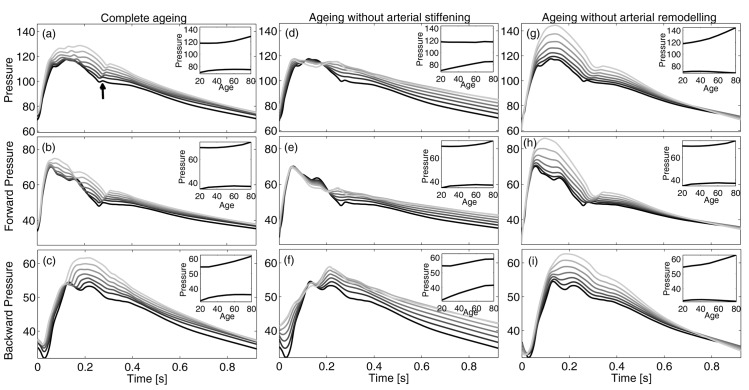
Fig 1. Pressure waves at ascending aortic section.
Upper row: total pressure, P, with physiological ageing (a), when the pulse wave velocity increase is removed (d), or the plastic geometric remodelling is not accounted (g). Middle and lower rows report the corresponding forward and backward pressures, respectively. The darker the younger, from 20 to 80 years old. Insets show the evolution of maximum and minimum pressures during ageing.

