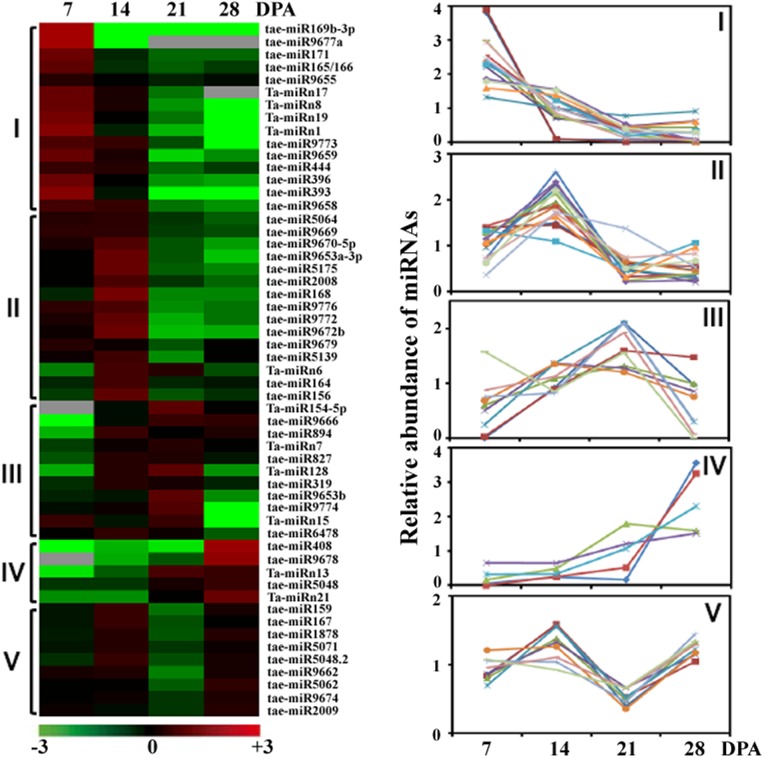
Fig 3. The 55 wheat grain development-related miRNAs.
Hierarchical cluster analysis of 55 differentially expressed miRNAs in wheat grains (7–28 DPA) was performed by comparing miRNA abundances (TPM) in each library to the average of the four libraries. Color scale indicates fold-change as log2, from high (red) to low (green). Five miRNA clusters are shown on the right.

