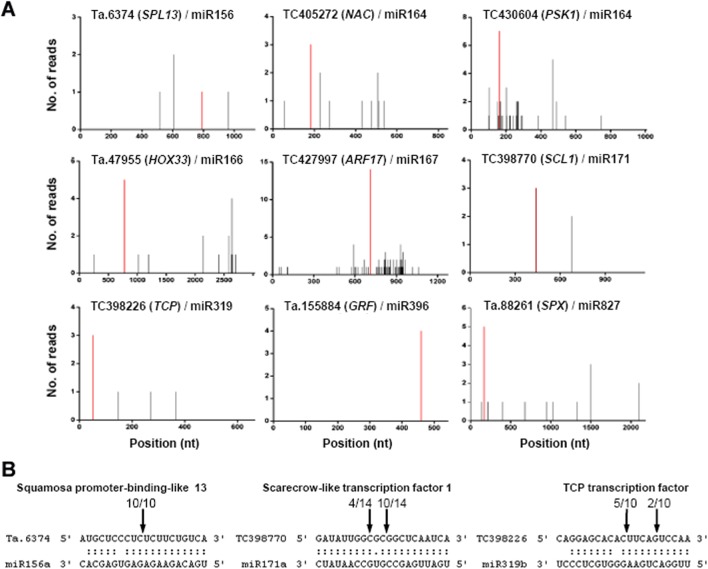
Fig 4. Verified targets of conserved development-related miRNAs.
(A) Confirmation of target mRNA cleavage by degradome sequencing. The t-plots show sequence abundances in the position of the target transcripts, with red lines indicating sequence reads consistent with miRNA-directed cleavage. All the data of the t-plots originated from degradome library II. (B) Mapping of target mRNA cleavage sites using 5′-RACE. Arrows indicate cleavage sites and the number shows the frequency of sequenced clones.

