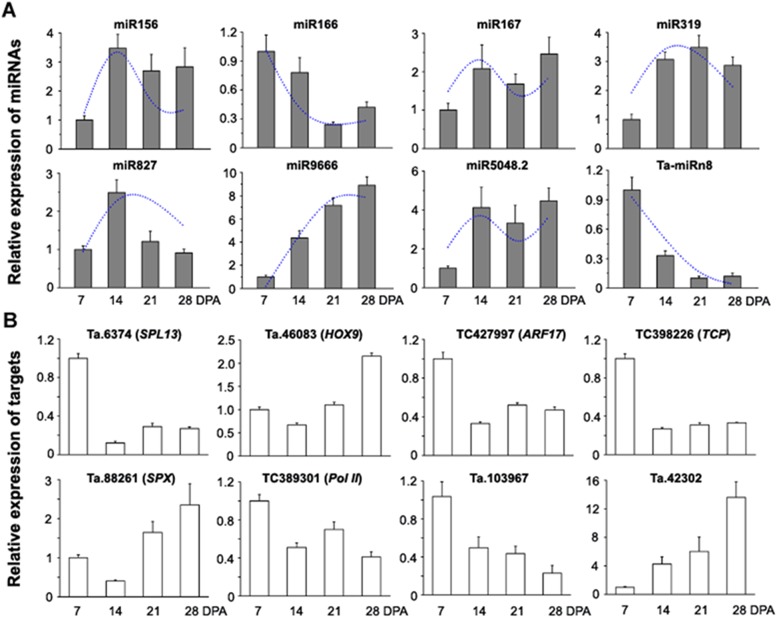
Fig 6. Expression correlation between development-related miRNAs and their targets.
(A) qRT-PCR analysis of miRNA expression in developing grains. The dots represent the relative abundances of sequence reads in four small RNA libraries. (B) qRT-PCR analysis of target expression in the developing grains. Data represent the mean values ± SD of three replicates.

