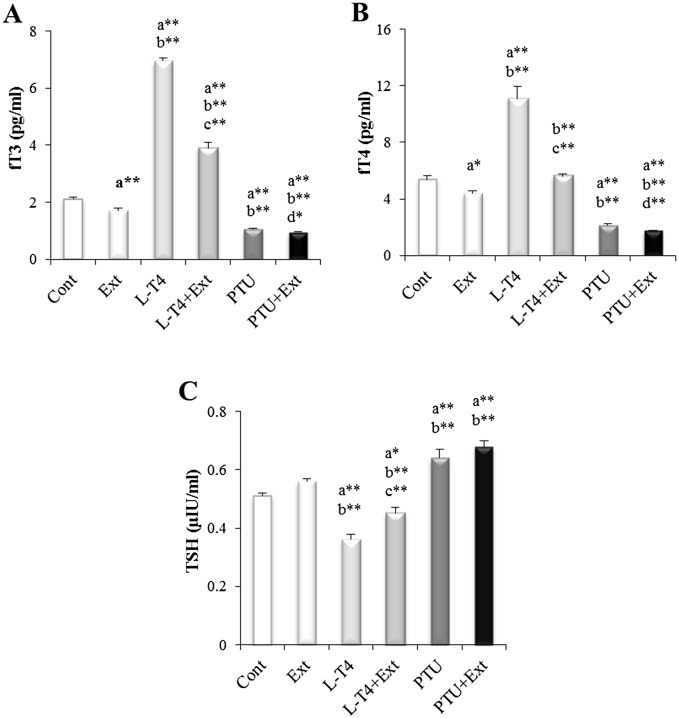
Fig 1. Effect of DPP extract (Ext) on serum levels of: (A) fT3, (B) fT4 and (C) TSH in normal, L-T4- and PTU-treated rats.
The data are presented as mean ± SEM (n = 10 rats/gp). The symbols * and ** represent statistical significant at p<0.05 and p<0.01, respectively. a: significant difference from normal control values, b: significant difference from Ext values, c: significant difference from L-T4 values and d: significant difference from PTU values.

